This article provides technical guidance for prioritizing loads during limited-capacity generator operations effectively and compliance.
Engineers and facility managers will find calculation methods, examples, tables, and normative references for compliance.
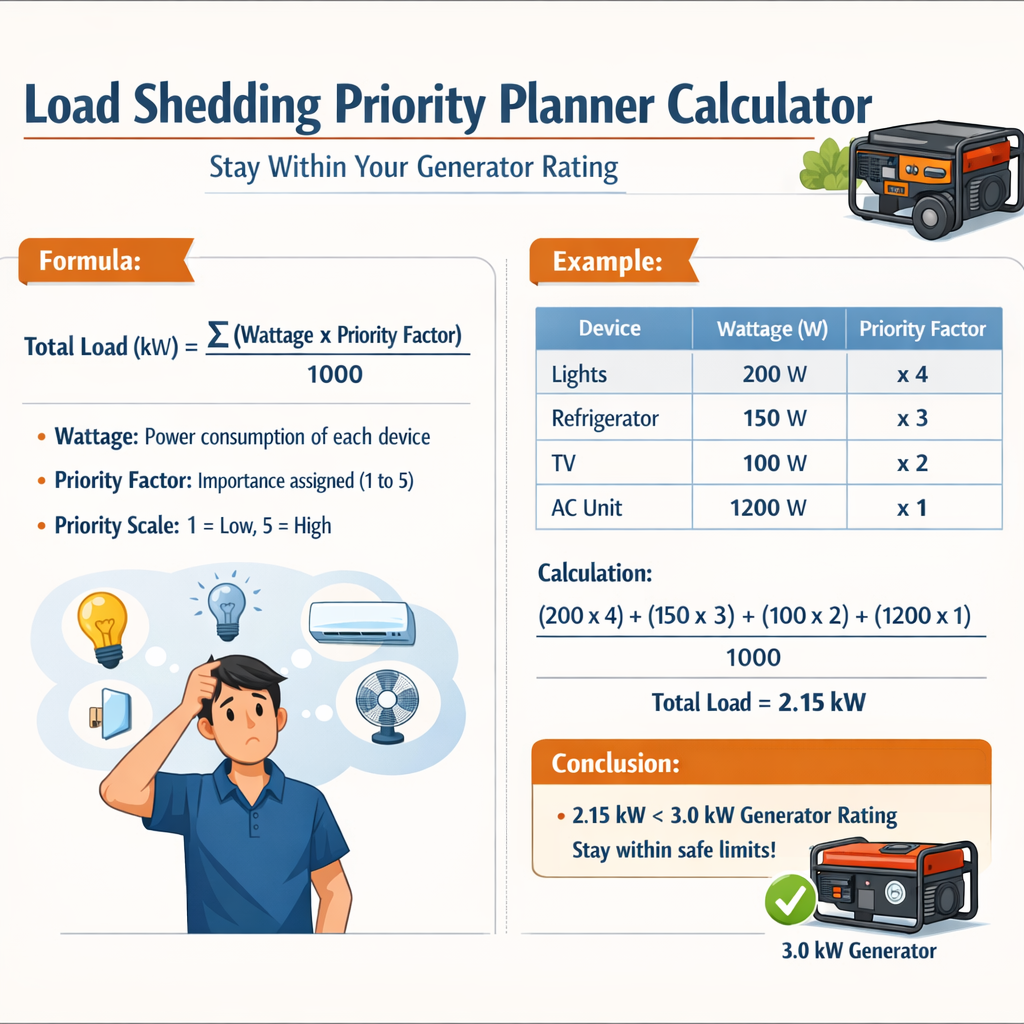
Load Shedding Priority Planner to Stay Within Generator kVA Rating
Operational context and objectives for a load shedding priority planner
When operating on backup generation, the primary objective is to remain within the generator continuous rating while preserving critical services. A load shedding priority planner calculates which circuits to disconnect, in which order, and when, so the sum of expected running and starting demands stays below the available generator capacity with an appropriate safety margin.
Key operational constraints
- Generator continuous kW or kVA rating and permitted overload duration (per manufacturer and applicable standards).
- Maximum allowable generator loading for fuel, cooling, and thermal limits (typically expressed as a percentage of nameplate rating).
- Motor starting inrush and locked-rotor currents that temporarily increase apparent power demand.
- Selective load shedding order determined by safety, process continuity, and contractual/service-level requirements.
- Regulatory and code requirements (e.g., life-safety circuits cannot be shed in many jurisdictions).
Fundamental calculations and formulas
All formulas below are presented using plain HTML and explained variable-by-variable, with typical values. Use kW for real power and kVA for apparent power.
1. Convert real power to apparent power
Where:
- S = apparent power (kVA)
- P = real power (kW)
- PF = power factor (decimal, e.g., 0.8)
Typical values: PF for resistive loads = 1.0, motors under load = 0.8 to 0.95, computers/IT = 0.9 to 0.99.
2. Total running apparent power (steady-state)
Where P_i and PF_i are each individual load's real power and power factor.
3. Short-duration surge (motor starting)
Motor starting kVA can be estimated from locked-rotor kVA per horsepower or by manufacturer data. Typical locked-rotor kVA/hp ranges from 6 to 8 for low-voltage motors.
4. Generator margin and allowable headroom
Where allowable_loading_percentage is the fraction (e.g., 1.0 for continuous limit or 1.1 for limited overloading allowed by manufacturer/standard).
5. Priority planner inequality
Ensure at all times: S_running_total + S_starting_simultaneous ≤ S_generator_rating × allowable_loading_percentage
Designing a priority-based shedding sequence
A formal priority planner assigns each load a priority tier and an expected connection characteristic (steady kW, PF, starting kVA, and required restart sequence). The planner must model transient events that increase apparent power for short durations.
Attributes for each load
- Priority tier (1 = highest/essential, 4 = non-essential)
- Steady-state P (kW) and PF
- Starting behavior: direct-on-line (DOL), reduced-voltage starter, soft-start, or VFD
- Starting kVA or locked-rotor kVA and estimated duration (seconds)
- Acceptable restart delay and shedding consequences
Algorithmic approach
- Inventory all loads with P, PF, starting kVA, and priority.
- Compute S_running_total (steady-state apparent sum).
- Determine S_generator_rating and allowable loading percentage from generator manufacturer datasheet and applicable standards.
- Create shedding sets (combinations of loads to disconnect) that reduce S_running_total sufficiently to accommodate anticipated starting surges of allowed loads.
- Sequence restarts with delays that prevent simultaneous starting surges exceeding remaining headroom.
- Include time-based hysteresis and minimum off-times to avoid cycling and damage.
Tables of common device values and parameters
| Device / Load | Typical Real Power (kW) | Typical Power Factor | Starting Characteristic | Estimated Starting kVA |
|---|---|---|---|---|
| LED Lighting (commercial) | 0.01–0.5 per circuit | 0.9–1.0 | No motor surge | ≈ P / PF |
| Server Rack (IT) | 1–10 per rack | 0.95–0.99 | Electronic PSU, small inrush | 1.0–1.3 × steady kVA |
| Roof-top HVAC (compressor) | 5–50 per unit | 0.85–0.95 | High motor starting (DOL) | 6–8 × kW/hp → often 4–8 × steady kVA |
| Water Pump (centrifugal) | 2–75 | 0.8–0.95 | Medium-high starting | 4–6 × steady kVA |
| Elevator (motor bank) | 5–50 | 0.8–0.95 | Complex, simultaneous motors | 6–10 × steady kVA depending on control |
| Refrigeration (walk-in) | 1–10 | 0.8–0.9 | Compressor start spike | 5–7 × steady kVA |
| Small Motor (1–10 hp) | 0.75–7.5 | 0.8–0.9 | High locked-rotor ratio | 6–8 kVA/hp (typical) |
| Commercial Kitchen Equip. | 1–15 | 0.95 | Minimal surge | ≈ steady kVA |
| Generator Type | Continuous Rating Factor | Typical Emergency Overload Allowance | Note |
|---|---|---|---|
| Standby Diesel | 1.0 (nameplate kW continuous) | 110% for 1 hour (manufacturer dependent) | Check manufacturer manual and NFPA 110 for allowable duty |
| Prime Power | Up to 100% variable | Less overload allowance | Designed for continuous operation |
| Natural Gas Generator | 0.95–1.0 | Limited overload, depends on fuel system | Fuel pressure changes affect transient capability |
Detailed step-by-step calculator methodology
This section defines how to construct a deterministic calculator (spreadsheet or simple program) to produce shedding strategies.
Inputs
- Generator nameplate rating: kW and kVA (kW_nameplate, kVA_nameplate)
- Generator allowable loading multiplier (e.g., 1.0 continuous, overload factor 1.1)
- List of loads: P_i (kW), PF_i, starting_kVA_i (or motor_hp)
- Priority level for each load
- Maximum simultaneous starts allowed (or transfer delay)
- Minimum off-time and on-time constraints for each load
Processing steps
- Compute steady apparent power per load: S_i = P_i / PF_i.
- Sum steady-state: S_running_total = Σ S_i (for currently connected loads).
- Compute generator available apparent capacity: S_available = kVA_nameplate × allowable_loading_multiplier.
- If S_running_total ≤ S_available − safety_margin → no shedding required. Else proceed to step 5.
- Create candidate shedding sets by removing lowest-priority loads until S_running_total ≤ S_available − expected_start_surge (if restarts are planned).
- For planned restarts after shedding, ensure the sequence of starts keeps S_running_total + peak_starting ≤ S_available.
- Verify time constraints and safeguards, then produce a prioritized shedding schedule with restart delays.
Safety margin and hysteresis
Include a safety margin (e.g., 5–10% of kVA_nameplate) to avoid repeated trips due to transients. Use hysteresis on reconnect thresholds to avoid rapid cycling.
Worked example 1 — Small commercial building (detailed)
Scenario: 200 kW diesel generator (standby), operating limit 110% for short durations but continuous rating 200 kW.
Load inventory
- Lighting: P = 8 kW, PF = 0.95
- IT room (server racks): P = 12 kW, PF = 0.97
- HVAC condensing unit A: P = 30 kW, PF = 0.88 (DOL compressor)
- HVAC condensing unit B: P = 30 kW, PF = 0.88 (DOL compressor)
- Water pump: P = 15 kW, PF = 0.9 (DOL)
- Kitchen equipment: P = 10 kW, PF = 0.95
- Elevator controls: P = 5 kW, PF = 0.9 (motor bank, rare use)
Step 1 — Compute steady-state apparent powers
Step 2 — Sum steady-state apparent power
Step 3 — Generator apparent capacity
Generator rating 200 kW; assume PF 0.8 nameplate kVA: kVA_nameplate = 200 / 0.8 = 250 kVA.
Allowable overload temporary factor = 1.10 → S_available = 250 × 1.10 = 275 kVA. Continuous safe limit = 250 kVA.
Step 4 — Consider starting surges
Estimate starting kVA: HVAC units locked-rotor 6 × kW/hp approximated as 6× steady kVA for inrush (conservative).
S_start_HVACA ≈ 6 × 34.09 = 204.54 kVA (if started DOL simultaneously — unrealistic). But realistic controls will stagger starts.
Step 5 — Determine shedding strategy
Because S_running_total (121.73 kVA) < S_available (275 kVA), steady-state is acceptable. However, simultaneous starting of both HVAC units would produce an unacceptable transient: if both started simultaneously the peak would be S_running_total + S_start_HVACA + S_start_HVACB − (their steady S already counted). Conservative approach models peak as steady plus additional starting increment. For staging, implement the following priority tiers:
- Tier 1 (essential): IT, lighting
- Tier 2 (important): kitchen, elevator (business continuity)
- Tier 3 (shedable if necessary): HVAC B, HVAC A
- Tier 4 (non-essential): water pump (if redundant systems or manual operation available)
Step 6 — Staggered restart schedule example
Initial transfer to generator: keep Tier 1 and Tier 2. Delay HVAC A start by 60 seconds, HVAC B by 180 seconds, and limit simultaneous starting to one motor at time. Use soft-start or wye-delta to reduce starting kVA where possible.
Detailed numeric check
Initial S_running_total with Tier 1+2 = S_lighting + S_IT + S_kitchen + S_elevator = 8.421 + 12.37 + 10.53 + 5.56 = 36.88 kVA.
S_available continuous = 250 kVA, huge margin for steady loads. Planed start of HVAC A: peak = 36.88 + (S_start_HVACA − S_HVACA) = 36.88 + (204.54 − 34.09) = 207.33 kVA < 250 kVA (acceptable).
After HVAC A is running, plan start of HVAC B: peak = (36.88 + 34.09) + (204.54 − 34.09) = 241.42 kVA < 250 kVA borderline; to be conservative, wait until generator stabilizes or use soft-start.
If both HVACs used soft-start reducing starting kVA to 2× steady kVA: S_start_HVACA = 2 × 34.09 = 68.18 kVA, leading to much lower peaks and safer sequencing.
Worked example 2 — Hospital critical loads with NFPA constraints
Scenario: Hospital with life-safety and critical care loads, generator rated 1,000 kW standby. NFPA 110 and local codes require life-safety circuits remain powered; other loads can be shed selectively.
Load inventory (selected)
- Emergency lighting and fire pumps (life-safety): P = 120 kW, PF = 0.95
- ICU equipment and ventilators (critical): P = 250 kW, PF = 0.98
- Sterilization room (autoclave): P = 60 kW, PF = 0.9, large inrush
- Food service equipment: P = 80 kW, PF = 0.95
- HVAC AHU and chiller compressors: P_total = 300 kW, PF = 0.88, high starting load
- Administrative lighting and outlets: P = 50 kW, PF = 0.95
- Elevators and lifts: P = 40 kW, PF = 0.9
Step 1 — Calculate steady apparent powers
Step 2 — Generator apparent capacity
Assume generator nameplate PF = 0.8, so kVA_nameplate = 1000 / 0.8 = 1250 kVA. Allow temporary overload 10% → S_available = 1375 kVA.
Step 3 — Steady-state total if everything connected
S_total_all = 126.32 + 255.10 + 66.67 + 84.21 + 340.91 + 52.63 + 44.44 = 970.28 kVA, which corresponds to ≈ 776.22 kW steady-state.
Step 4 — Consider starting surges
HVAC starting spike if chiller motors start: estimate 6 × steady kVA per compressor bank while starting: S_start_HVAC = 6 × 340.91 = 2,045.46 kVA (if attempted simultaneously — unacceptable).
Autoclave inrush could be 3× steady kVA for a short time: S_start_autoclave = 3 × 66.67 = 200 kVA increment.
Step 5 — Prioritization and sequencing under NFPA 110
NFPA 110 requires life-safety and critical loads to be maintained or rapidly powered. Therefore:
- Tier 1: Life-safety (fire pumps), ICU critical equipment
- Tier 2: Essential surgical suites, sterilization (may run selectively)
- Tier 3: HVAC can be partially shed or run on reduced capacity
- Tier 4: Administrative and non-essential services
Step 6 — Numeric sequencing to stay within rating
Initial transfer: connect Tier 1 and Tier 2 (except large HVAC compressors). S_initial = S_life_safety + S_ICU + S_autoclave (if clinically required) = 126.32 + 255.10 + 66.67 = 448.09 kVA.
Available headroom for starting surges = 1250 − 448.09 = 801.91 kVA (continuous). Since the generator can accept short overloads up to 1375 kVA, temporary headroom for surge = 1375 − 448.09 = 926.91 kVA.
If starting an HVAC compressor single-phase spike is estimated at +400 kVA above its steady presence, sequencing each compressor with at least 30 s delay keeps peaks below temporary headroom. Use soft-starts or VFDs where possible.
Verification
After selecting a start schedule (e.g., bring one chiller compressor on at a time with 60 s spacing and limit autoclave starts to non-simultaneous), recompute worst-case peak for each start event and confirm it is ≤ S_available (1375 kVA) for temporary events and ≤ kVA_nameplate (1250 kVA) for sustained states beyond manufacturer allowed overload durations.
Implementing an automated Load Shedding Priority Planner Calculator
Practical implementation can be in spreadsheet or a small control PLC/SCADA module. Core functions:
- Real-time measurement of generator output and load currents via CTs.
- Database of loads with attributes (P, PF, starting_kVA, priority, minimum_off_time).
- Decision logic to implement shedding and reconnecting in safe sequences.
- Alarms and logs for regulatory compliance and post-event analysis.
Recommended features
- Simulate "what-if" scenarios with variable generator loading and different starting sequences.
- Allow operator override with interlocks for life-safety circuits.
- Provide automated soft-start enable signals if soft-start/VFDs present.
- Record time-stamped events for NFPA 110 logging requirements.
Regulatory and normative references
Key standards and authoritative resources applicable to generator operation, emergency power, and load shedding planning include:
- NFPA 110 — Standard for Emergency and Standby Power Systems. Official: https://www.nfpa.org/ (search NFPA 110)
- NFPA 70 — National Electrical Code (NEC), requirements for emergency systems: https://www.nfpa.org/
- IEEE 446 — IEEE Recommended Practice for Emergency and Standby Power Systems for Industrial and Commercial Applications: https://standards.ieee.org/
- IEC 60364 series — Electrical installations of buildings (general guidance on generators and emergency systems): https://www.iec.ch/
- Manufacturer generator operation and installation manuals — follow specific rated overload and thermal curves (e.g., Caterpillar, Cummins, Generac official documentation)
- US Department of Energy (DOE) guidance on backup power and microgrid design: https://www.energy.gov/
Practical recommendations and best practices
- Always use manufacturer generator curves for overload duration and allowed transient loading; do not rely solely on simplified multipliers.
- Install current measurement and power monitoring at feeder-level to measure actual steady-state and transient behavior.
- Use soft-starters or VFDs on large motors to reduce starting kVA and allow more circuits to remain connected.
- Implement staggered restart timers and limit the number of simultaneous motor starts.
- Design shedding tiers in consultation with stakeholders (clinical staff, production managers) to ensure safety and process continuity.
- Test regularly under controlled conditions and record event logs for regulatory compliance.
Common pitfalls to avoid
- Ignoring transient starting currents — steady-state kW sums can underpredict peak demands by several times for motor-dominated systems.
- Assuming nameplate PF equals operating PF — measure or use conservative PFs for older motors or equipment.
- Failing to include inrush from electronic loads (IT inrush, UPS battery charger peaks).
- Not verifying generator voltage stability during peaks — excessive voltage dip can cause equipment trips.
- Overloading the generator for durations longer than manufacturer approval increases risk of failure.
Appendix: quick conversion formulas and typical numeric values
Power conversions and quick references for calculator implementations.
| Formula | Expression | Explanation |
|---|---|---|
| Apparent power | S = P / PF | Convert kW to kVA using a power factor (PF between 0 and 1). |
| kVA to kW | P = S × PF | Compute usable real power from apparent rating. |
| Generator kVA | kVA_nameplate = kW_nameplate / PF_nameplate | Use nameplate PF (commonly 0.8) to get apparent rating. |
| Starting kVA estimate (motors) | S_start ≈ locked-rotor_kVA_per_hp × hp | Locked-rotor kVA/hp about 6–8 for small low-voltage motors. |
Final operational checklist
- Verify generator rating and allowable overload durations from manufacturer manual.
- Create and validate a detailed load inventory with PF and starting characteristics.
- Design priority tiers that respect life-safety and critical continuity obligations.
- Implement staged start logic and soft-start devices to limit peak kVA.
- Install monitoring and logging to validate assumptions and support post-event analysis.
- Perform periodic drills and maintenance per NFPA 110 and manufacturer recommendations.
References
- NFPA 110, Standard for Emergency and Standby Power Systems. National Fire Protection Association. https://www.nfpa.org/
- NFPA 70, National Electrical Code. National Fire Protection Association. https://www.nfpa.org/
- IEEE Std 446, IEEE Recommended Practice for Emergency and Standby Power Systems for Industrial and Commercial Applications. IEEE Xplore. https://standards.ieee.org/
- IEC Standards related to installations and generator testing. International Electrotechnical Commission. https://www.iec.ch/
- US Department of Energy guidance on backup power and microgrids. https://www.energy.gov/
- Manufacturer generator specification and installation manuals (example: Cummins, Caterpillar, Generac official websites for model-specific thermal and overload curves).