This article provides a precise, technical method to estimate UPS battery recharge time accurately worldwide.
Calculations integrate charger kW, charger A, battery capacity, efficiency, state of charge, and temperature variations.
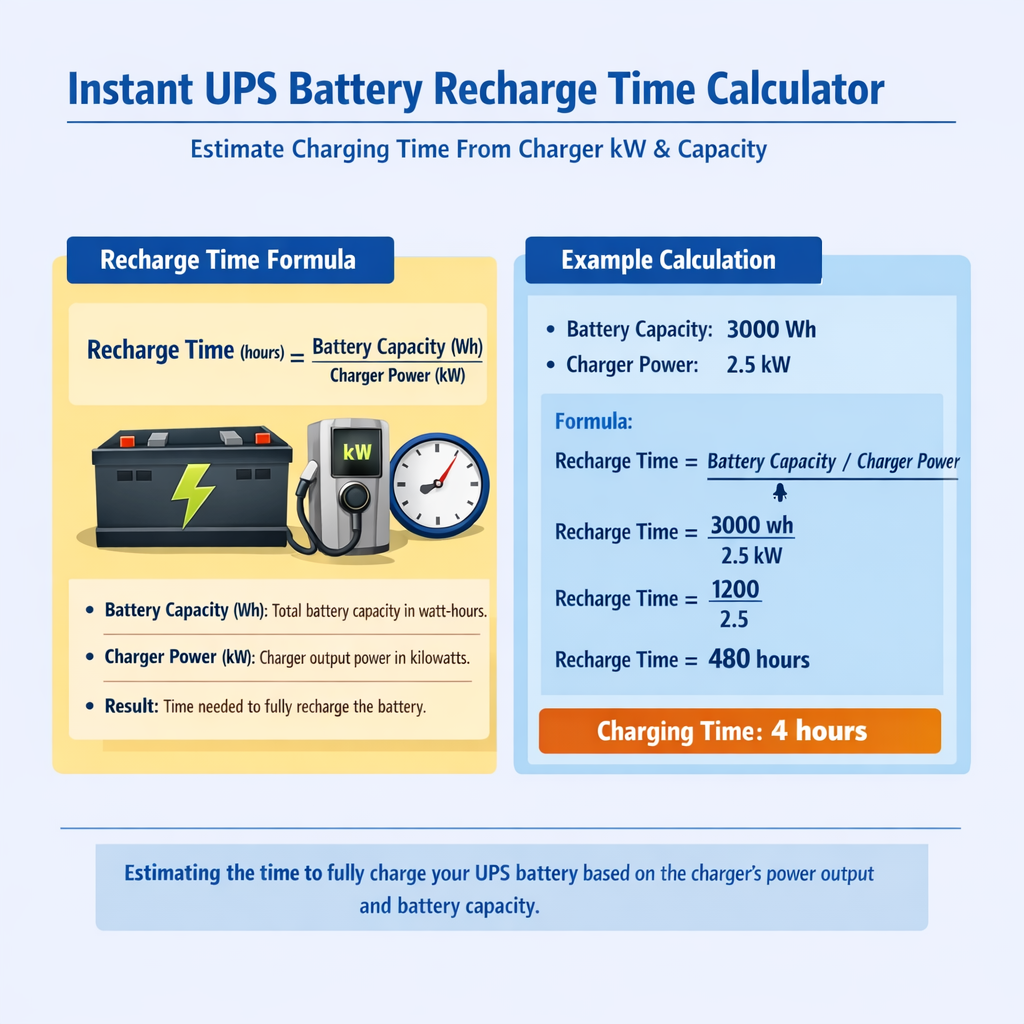
Instant UPS Battery Recharge Time Calculator (Estimate Charging Time from Charger kW and Battery Capacity)
The calculator estimates the recharge time from the available charger DC power and the effective usable battery energy.
- Total nominal battery energy (kWh) = DC voltage (V) × capacity (Ah) / 1000
- Effective usable capacity (Ah) = nameplate capacity (Ah) × battery capacity derating (%) / 100
- Energy to be recharged (kWh) = total nominal energy × (SOC target − SOC initial) / 100
- Effective charging power (kW) = charger rated DC power (kW) × charger utilization factor (%) / 100 × charge efficiency (%) / 100
- Recharge time (h) = energy to be recharged (kWh) / effective charging power (kW)
Units are strictly SI: voltage in volts (V), current in amperes (A), capacity in ampere-hours (Ah), energy in kilowatt-hours (kWh), power in kilowatts (kW), and time in hours (h) and minutes (min).
| UPS DC voltage (V) | Typical battery capacity (Ah) | Typical charger DC power (kW) | Approx. full recharge time from 50 % SOC (h) |
|---|---|---|---|
| 24 | 65 | 1 | ~1.6 h |
| 48 | 100 | 3 | ~0.8 h |
| 110 | 300 | 10 | ~1.8 h |
| 220 | 500 | 25 | ~2.0 h |
| 400 | 800 | 50 | ~1.8 h |
Technical FAQ about the UPS battery recharge time calculator
- Does the calculator use the DC charging power or the AC input rating of the UPS?
- The calculation is based on the effective DC charging power available to the battery. If only the AC input power is known, it should be converted to DC kW by applying charger efficiency and power factor before using this tool.
- How does depth of discharge affect the estimated recharge time?
- The deeper the discharge (lower initial state of charge), the larger the energy deficit that must be restored. The calculator explicitly uses the difference between target SOC and initial SOC to determine the recharge energy.
- Why is charge efficiency included as an advanced parameter?
- Not all the energy delivered by the charger is stored in the battery due to electrochemical and conversion losses. The charge efficiency parameter accounts for these losses and slightly increases the expected recharge time compared with the ideal case.
- Is the calculated recharge time a constant-current, constant-voltage (IU) accurate model?
- No. The tool provides a first-order energy-based estimate assuming average effective charging power. Real UPS chargers operate with IU curves and taper the current near full charge, so measured recharge times may be slightly longer than the ideal value.
Scope and engineering objectives
This document defines a clear engineering methodology for estimating recharge time for UPS battery systems when supplied by a charger specified in kW or A. It targets designers, facility engineers, commissioning teams, and technical procurement specialists needing repeatable, auditable calculations.
Fundamental energy and power relationships
Basic energy balance
To estimate recharge time we apply conservation of energy between the battery energy deficit and the energy delivered by the charger corrected for losses.
Relating Ah, V and kWh
Many battery data sheets list capacity in ampere-hours (Ah) and nominal voltage (V). Convert Ah to energy:
Example typical voltages: 12 V (single cell/module), 24 V (small UPS stacks), 48 V (common telecom/IT UPS battery assemblies), 192 V or 384 V for larger stringed packs.
Power, current and voltage relationships (DC and AC)
Charger power and current are linked by the DC bus voltage (for DC-side calculations) or by AC mains when specifying AC-side current.
For DC charging:
Rearranged:
Practical factors that modify the ideal charging time
- Charger nominal power vs. actual available power (e.g., AC input limits, power factor, charger derate).
- End-of-charge tapering: most battery chemistries use constant-current (CC) bulk then constant-voltage (CV) absorption phases; effective power falls during the absorption phase.
- Charge acceptance efficiency η_ca: not all delivered energy becomes stored chemical energy (heat losses, gassing, internal resistance). Typical η_ca ranges by chemistry and SoC: lead-acid (75–90%), lithium-ion (90–98%).
- Battery temperature: colder batteries accept charge slower and require higher charger voltages for full charge; include derating factors per manufacturer curves.
- Battery management system (BMS) limits on maximum charge current and charge profile (especially for Li-ion).
- State-of-Health (SoH) and aging: aged batteries may show reduced capacity and acceptance.
Comprehensive charging-time formula with corrections
Base algebraic formula:
Where:
- Required energy (kWh) = C_kWh × (SoC_target − SoC_initial)
- η_total = η_charger × η_charge_acceptance × η_system_losses
Expanded formula using Ah and V
If capacity is given in Ah:
When charger current limit dominates
If the charger's current limit is the binding constraint, compute time from current and Ah:
Then apply an efficiency correction for acceptance and absorption phases.
Typical variable values and engineering assumptions
To convert the formulas into repeatable calculations, adopt typical values and explicit assumptions. Use the following as defaults unless manufacturer data indicates otherwise:
- Lead-acid VRLA charging efficiency (bulk+absorption) η_ca = 0.85 (range 0.75–0.95 depending on SoC and temperature).
- Lithium-ion charging efficiency η_ca = 0.95 (range 0.90–0.98).
- Charger AC-to-DC efficiency η_charger = 0.95 (modern high-efficiency chargers 0.92–0.98).
- System wiring and distribution losses η_system_losses = 0.99 (small percentage).
- Net η_total = η_charger × η_ca × η_system_losses. Typical net values: lead-acid 0.80–0.90, Li-ion 0.88–0.94.
- Absorption-phase extra time: add 5–30% to bulk time for lead-acid when charging to >85% SoC due to current tapering; Li-ion absorption time is shorter but BMS limits may apply.
Extensive tables of common values
| Battery type | Nominal V (typical) | Common Ah ratings | Approx kWh per module | Typical η_ca |
|---|---|---|---|---|
| VRLA (12 V cell) | 12 | 7, 12, 26, 100, 200 Ah | 0.084 (7Ah) — 2.4 (200Ah) | 0.75–0.90 |
| 48 V UPS string (series 4×12 V) | 48 | 20, 50, 100, 200 Ah | 0.96 (20Ah) — 9.6 (200Ah) | 0.75–0.90 |
| Lithium-ion (modular) | 48–400 V | 20–2000 Ah (varied) | 1–100+ kWh | 0.90–0.98 |
| Large stationary strings | 192, 240, 384 V | 100–2000 Ah (system) | 19.2–768 kWh | 0.80–0.95 |
| Charger rating (kW) | Battery string voltage (V) | DC charging current (A) | Notes |
|---|---|---|---|
| 1 kW | 48 V | 20.83 A | Small UPS or float chargers |
| 2 kW | 48 V | 41.67 A | Typical small telecom charger |
| 5 kW | 48 V | 104.17 A | Medium UPS battery chargers |
| 10 kW | 48 V | 208.33 A | Large UPS battery packs / fast recharge |
| 20 kW | 192 V | 104.17 A | Higher-voltage systems reduce current for same power |
| Scenario | Capacity (kWh) | SoC initial | SoC target | ΔSoC | Required energy (kWh) |
|---|---|---|---|---|---|
| Small UPS | 2.4 | 20% | 90% | 70% | 1.68 |
| Medium bank | 9.6 | 30% | 95% | 65% | 6.24 |
| Large string | 48.0 | 10% | 100% | 90% | 43.2 |
Charge profile engineering: CC/CV and practical timing
Real battery charging rarely runs at full power until target SoC; instead:
- Bulk (CC): Charger supplies maximum allowed current; battery voltage rises.
- Absorption (CV): Charger holds voltage; current tapers; stored energy per unit time reduces, increasing time to finish.
- Float: Maintains full charge with low current.
For an engineer estimating time, separate the calculation into a bulk portion (where charger can deliver rated power) and an absorption portion (where current tapers). Many practical estimates use a bulk-to-absorption split point at approximately 80–90% SoC for lead-acid, and ~90–95% for Li-ion.
Worked examples — complete development and results
Example 1 — 48 V, 200 Ah VRLA battery bank charged with 5 kW charger
Given data and assumptions:
- Battery nominal voltage V = 48 V
- Capacity = 200 Ah
- Battery energy C_kWh = (200 Ah × 48 V) ÷ 1000 = 9.6 kWh
- SoC_initial = 30% (0.30), SoC_target = 95% (0.95)
- ΔSoC = 0.95 − 0.30 = 0.65
- Required energy = 9.6 kWh × 0.65 = 6.24 kWh
- Charger rated power P_charger = 5 kW
- Assume charger efficiency η_charger = 0.95, charge acceptance η_ca = 0.85, system losses = 0.99
- η_total = 0.95 × 0.85 × 0.99 = 0.799575 ≈ 0.80
Step 1 — Ideal time ignoring acceptance losses:
Step 2 — Apply total efficiency:
Adjusted_time = Required_energy ÷ (P_charger × η_total) = 6.24 ÷ (5 × 0.80) = 6.24 ÷ 4 = 1.56 h
Converted to minutes: 1.56 × 60 = 93.6 minutes → 1 hour 33.6 minutes ≈ 1 hour 34 minutes.
Step 3 — Add absorption-phase extension: For VRLA charging to 95% we add 15% extra to account for tapering and top-off.
Final_estimated_time = 1.56 × 1.15 = 1.794 h = 107.64 minutes ≈ 1 hour 48 minutes.
Verification with charger current limit:
Bulk-time estimate from Ah: Bulk_time = (200 Ah × 0.65) ÷ 104.17 A = 130 Ah ÷ 104.17 ≈ 1.248 h (same as ideal_time). Then apply acceptance/absorption corrections as above to match final estimate (~1.79 h).
Engineering note: If the battery manufacturer specifies a different charge acceptance curve, substitute measured η_ca and absorption time instead of using percentage rules.
Example 2 — 192 V battery string, 48 kWh bank, charged from a 10 kW charger (Li-ion)
Given:
- Battery energy = 48.0 kWh (system-level)
- Nominal pack voltage = 192 V (for current calculation only)
- SoC_initial = 10% (0.10), SoC_target = 100% (1.00)
- ΔSoC = 0.90
- Required energy = 48.0 × 0.90 = 43.2 kWh
- Charger rating = 10 kW
- Assume η_charger = 0.96, η_ca (Li-ion) = 0.96, system losses = 0.99
- η_total = 0.96 × 0.96 × 0.99 = 0.912768 ≈ 0.913
Base time ignoring losses:
Apply efficiency:
Li-ion absorption/top-off: BMS may limit current above 90% SoC; add a conservative 8% overhead for top-off if charging to 100%:
Check current:
Equivalent Ah throughput required = Capacity_Ah × ΔSoC. Compute capacity Ah = (48.0 kWh × 1000) ÷ 192 V = 250 Ah.
Ah to transfer = 250 Ah × 0.90 = 225 Ah. Bulk time by current = 225 Ah ÷ 52.083 A ≈ 4.32 h — consistent with ideal energy-based time; then adjust with efficiencies/top-off to final estimate (~5.11 h).
Operational checks and commissioning guidance
- Validate actual charger output power under expected ambient and mains conditions — check nameplate vs measured DC output using power analyzer.
- Confirm battery voltage and pack configuration before converting Ah to kWh.
- Obtain manufacturer charge acceptance curves and temperature compensation data. Substitute measured η_ca for more accurate estimates.
- Account for PV or generator interaction if charger is powered from a limited source (generator sizing constraints may impose further derate).
- For redundancy planning, run simulations with worst-case SoH and lowest expected charger power.
Advanced topics for precision modeling
Time domain models and numeric integration
For high-fidelity estimation, model the CC→CV transition with time-stepping numeric integration of instantaneous power into the battery until SoC reaches target. Use these steps:
- Define charge profile: constant current I_cc until voltage reaches V_cv, then hold voltage and compute I(t) from battery internal resistance and SoC relationship.
- At each time step Δt compute delivered energy ΔE = V_batt(t) × I(t) × Δt and accumulate SoC accordingly.
- Include temperature-dependent resistance and BMS limits.
This approach requires battery equivalent-circuit parameters (R_internal, open-circuit voltage vs. SoC curve). It is the method used in detailed BMS and battery test labs.
Temperature, aging, and derating
- Nominal battery capacity reduces with lower temperature (~0.5–1%/°C below optimal for many chemistries).
- Charge acceptance declines when cell temperature is low; for lead-acid, a common engineering rule is to derate charge current by 1%/°C below 25°C.
- Aging: expected capacity fade per cycle or per year must be included in longer-term recharge planning (e.g., 2–5% capacity loss per year depending on chemistry and cycling pattern).
Verification, safety and regulatory references
Use authoritative standards and vendor documents to validate charging procedures, safety limits, and performance claims. Key references include:
- IEC 62040 series — UPS systems standards (performance, testing, and safety guidance).
- IEC 62485 — Safety requirements for secondary batteries installed in stationary applications.
- IEEE standards (e.g., IEEE 1184, IEEE 450) — recommended practices for battery maintenance and stationary applications.
- UL 1778 — Standard for Uninterruptible Power Systems (safety requirements in North America).
- Manufacturer datasheets and application notes: APC by Schneider Electric, Eaton UPS battery guides, Vertiv technical papers.
Practical rules-of-thumb for quick estimation
- Approximate recharge time (hours) ≈ (Battery kWh × ΔSoC) ÷ (Charger kW × 0.85) — use 0.85 as a conservative net efficiency for mixed installations.
- If battery capacity is in Ah: convert to kWh first, or approximate by multiplying Ah by nominal voltage and dividing by 1000.
- For top-up to float (small ΔSoC < 10%), expect real time longer than proportional due to CV tapering; add 20–50% for lead-acid top-ups.
Checklist for deployment engineers
- Record battery nominal voltage, Ah, manufacturer SoC curves, and BMS limits.
- Obtain charger kW rating, maximum DC output current, and efficiency vs load curve.
- Decide target SoC and allowable recharge window (time budget).
- Compute required energy and preliminary charge time using formulas above.
- Perform a commissioning charge test under controlled conditions and measure actual time; update model coefficients.
Additional worked case — constrained input supply and charger derate
Scenario: A data center has a generator-limited supply; the charger cannot draw more than 15 A at 400 V AC (3-phase) due to upstream constraints. Charger power must be derived from available AC current and power factor.
- Available AC apparent power S = √3 × V_line × I_line = √3 × 400 V × 15 A ≈ 10.39 kVA
- Assume charger input PF = 0.95 and efficiency η_charger = 0.94
- Available DC power ≈ S × PF × η_charger ≈ 10.39 × 0.95 × 0.94 ≈ 9.27 kW
- Use this effective charger power to compute recharge time as in earlier formula.
Engineering consequence: In constrained-electrical environments always compute charger power from actual supply limits, not nameplate, to avoid scheduling errors.
References and further reading
- IEC 62040-3: Uninterruptible power systems (UPS) — performance and test methods. International Electrotechnical Commission. https://www.iec.ch
- UL 1778: Uninterruptible Power Systems Standard. Underwriters Laboratories. https://www.ul.com
- IEC 62485: Safety requirements for stationary batteries. https://www.iec.ch
- IEEE Std 450: Recommended Practice for Maintenance, Testing, and Replacement of Vented Lead-Acid Batteries for Stationary Applications. https://standards.ieee.org
- APC by Schneider Electric application notes: Battery charging and recharge time guidelines. https://www.apc.com
- Eaton white papers: UPS battery recharge best practices. https://www.eaton.com
SEO and practical keywords for technical documentation
To ensure strong discoverability for procurement teams and engineers, include keyword phrases such as: UPS battery recharge time calculator, charger kW to hours, estimate charging time from charger A, battery capacity kWh to recharge hours, UPS battery recharge calculator, battery charge acceptance efficiency, CC/CV charging time estimate.
Final engineering notes
Use the provided formulas and worked examples as a repeatable template. Replace default efficiencies and manufacturer parameters with measured or vendor-provided curves for the most accurate results. For automated calculations integrate a numeric solver or spreadsheet implementing stepwise CC→CV integration when high accuracy is required for commissioning, warranty validation, or operational planning.