Rapid, accurate bus rating calculators prevent overloads and ensure compliant main distribution panel designs safely.
Engineers require margining for demand growth, fault levels, harmonics, temperature, and future expansion planning strategies.
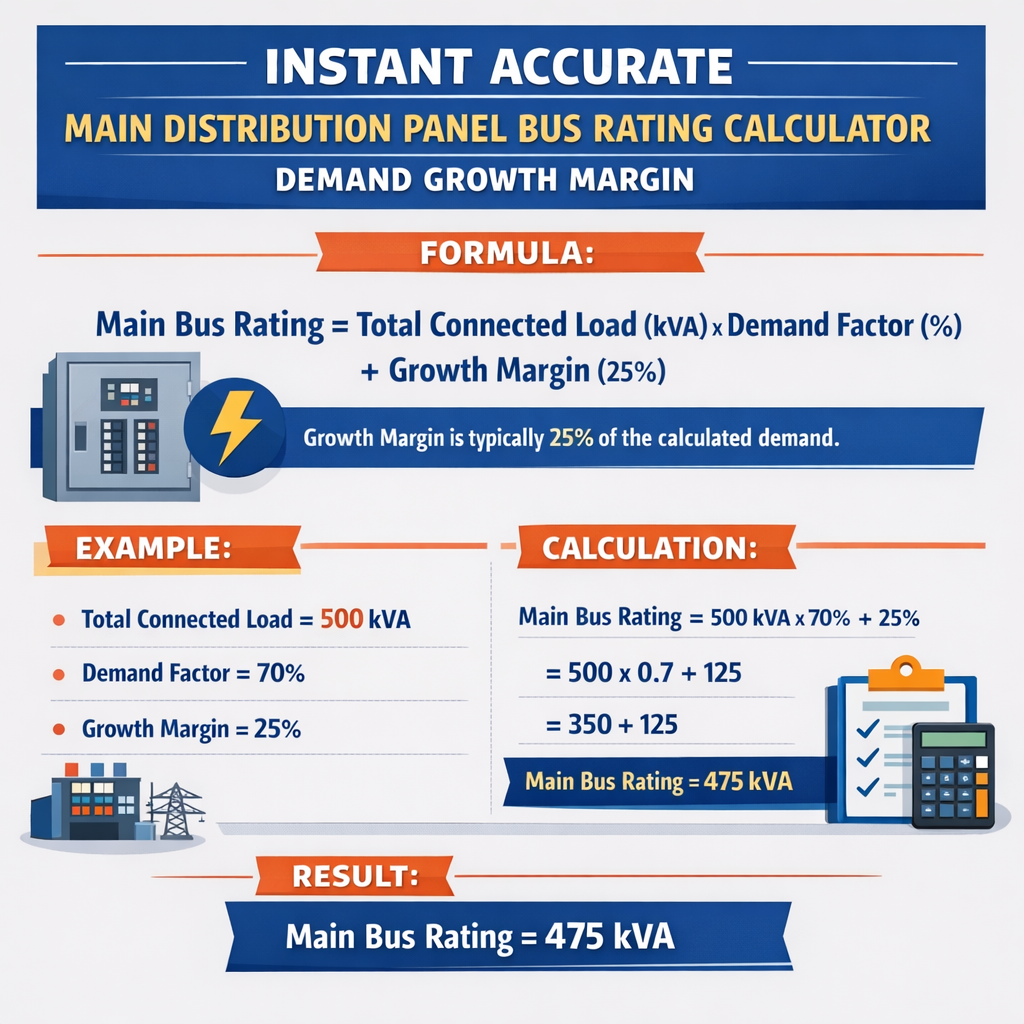
Instant Main Distribution Panel Bus Rating Calculator with Demand Growth Margin
Scope, intent, and performance targets for instant bus rating estimation
Main distribution panel (MDP) bus rating calculators must deliver an instant, accurate recommended bus ampacity and mechanical/thermal withstand level that incorporate demand growth margin, ambient and operational deratings, fault current withstand, harmonic amplification, and redundancy strategy. This article specifies a deterministic calculation flow, equations, typical values, and standards-based verification to choose a compliant MDP bus rating for low-voltage power distribution (up to 1 kV LV systems; principles also applicable to medium voltage with platform adjustments). The method emphasizes:- Deterministic load aggregation with demand factors and diversity per recognized code tables.
- Application of growth margin and planning horizon to derive future-rated bus capacity.
- Thermal/derating correction for ambient temperature, enclosure grouping, and harmonic content.
- Short-circuit withstand and ultimate closing/withstand ratings assessment using utility fault levels and device interrupting capabilities.
Key variables, symbols, and definitions
Primary variables used in calculations
- P_total — Total connected apparent power (kVA or kW). Typical value: aggregated nameplate sum.
- V_ll — Line-to-line nominal voltage (V). Typical values: 400 V, 480 V, 600 V.
- PF — Power factor (unitless). Typical values: 0.8–0.95 depending on motor and plant load.
- I_load — Calculated continuous current per bus (A).
- DF — Demand factor (unitless), reflecting diversity per load type and code guidance.
- GM — Growth margin (unitless or percent), planning allowance for future load increase.
- T_corr — Temperature correction factor (unitless) for conductor/bus ampacity.
- HCF — Harmonic correction factor (unitless) accounting for increased heating due to non-sinusoidal currents.
- I_sc — Available short-circuit current at the MDP bus (kA).
- I_bus_rating — Selected standard bus rating (A).
Core formulas for bus rating and margining
Base load current from connected load
Explanation of variables and typical values:
- P_total in watts (W) or in kW × 1000. Example: 500 kW = 500000 W.
- sqrt(3) = 1.73205 (three-phase systems).
- V_ll typical: 400 V (Europe), 480 V (North America industrial), 600 V.
- PF typical: 0.9 for mixed loads; motor-heavy systems may be 0.85.
Applying demand factor and simultaneity
DF is selected using code (for example, NEC Article 220 tables for specific premises) or empirical diversity factors: 0.4–1.0 depending on aggregate loads and their usage profiles.
Applying growth margin and derating factors
Notes:
- GM typical planning horizon values: 10% per 5 years, 20–30% for 10-year planning depending on project.
- T_corr: ambient and grouping correction; typical range 0.70–1.00 depending on standard tables and bus material.
- HCF: harmonic derating (e.g., 0.9 for significant non-linear loads; can be more conservative).
Selecting a standard bus rating
Standard bus ampacities (typical): 100 A, 225 A, 400 A, 600 A, 800 A, 1200 A, 1600 A, 2000 A, 3000 A, 4000 A.
Short-circuit and mechanical withstand check
Verify that bus and device interrupting rating and mechanical withstand meet or exceed available fault current I_sc:
- Bus mechanical withstand and thermal rating (kA for one second) must be ≥ I_sc.
- Circuit breakers and fused devices must have adequate interrupting ratings (AIC/kA) at nominal voltage.
Tables with common values and lookup references
| Standard Bus Rating (A) | Typical Busbar Cross-Section (mm², Cu eq.) | Approx. Continuous Ampacity (A) | Typical Use |
|---|---|---|---|
| 100 | 25 | 100 | Small service panels, light commercial |
| 225 | 50 | 225 | Small commercial, distribution to floor panels |
| 400 | 95 | 400 | Medium industrial distribution |
| 600 | 150 | 600 | Large commercial and light industrial |
| 800 | 185–240 | 800 | Major distribution, campus feeders |
| 1200 | 300 | 1200 | Primary distribution in plants |
| 2000 | 500+ | 2000 | Large plants, critical facilities |
| 3000–4000 | 750–1000+ | 3000–4000 | Utility/tie switchgear and main busways |
| Ambient Temp (°C) | Typical Temp Correction Factor (Cu/Al) | Application Notes |
|---|---|---|
| 25 | 1.00 | Baseline per standard tables |
| 30 | 0.96 | Minor correction |
| 40 | 0.91 | Common industrial ambient |
| 50 | 0.82 | Hot environments; consider ventilation |
| 60 | 0.71 | Severe derating; large effect on bus selection |
| Load Type | Typical Demand Factor (DF) | Reference |
|---|---|---|
| Lighting and receptacles (commercial) | 0.8–1.0 | Code tables or historical data |
| Motors (industrial) | 0.4–0.9 | Depends on simultaneity and starting strategy |
| HVAC | 0.6–0.9 | Plant schedule dependent |
| Data center IT | 0.6–0.9 | Racks often have high diversity; use measured profile |
Stepwise algorithm for an instant, accurate calculator
- Collect nameplate loads and categorize by load type (motors, resistive, lighting, UPS/inverter loads).
- Sum P_total (kW) and convert to I_load using system voltage and PF with the formula above.
- Apply DF per load category and aggregate to I_demanded.
- Apply planning growth margin GM: choose based on project horizon (e.g., 10% for 5 years, 25% for 10 years).
- Apply ambient, grouping, and harmonic correction factors (T_corr, HCF) to compute corrected current.
- Select nearest standard bus rating ≥ I_corrected and verify device interrupting and bus mechanical withstand vs I_sc.
- Perform conductor sizing, busbar cross-section checks, and thermal modeling for worst-case continuous duty.
- Document results, assumptions, and references to applicable standard tables (NEC, IEC 61439, IEEE standards).
Formula set for harmonic and thermal amplification
Explanation:
- I_rms — root-mean-square current contribution based on load.
- K_h — harmonic heating factor (typical values: 1.0 for near-sinusoidal, 1.05–1.25 for significant harmonics; compute per IEEE 519 guidance).
Real case study 1 — Industrial plant MDP sizing with motors and HVAC
Project data and assumptions
- Nominal voltage V_ll = 480 V three-phase.
- Connected loads (nameplate): 400 kW motors, 200 kW HVAC, 150 kW lighting and receptacles, 50 kW auxiliary (total P_total = 800 kW).
- Power factor assumed PF = 0.90 (plant will correct to 0.95 later, but current sizing uses 0.90 conservative).
- Demand factor selections:
- Motors DF_motors = 0.7 (because not all motors start simultaneously).
- HVAC DF_HVAC = 0.85.
- Lighting DF_light = 0.9.
- Auxiliary DF_aux = 0.8.
- Growth margin GM = 25% (10-year horizon allowing future expansion and equipment upgrades).
- Ambient temperature 40°C → T_corr = 0.91 (per table above).
- Harmonic correction HCF = 0.95 (moderate harmonic content expected).
Step-by-step calculation
1) Aggregate P_total = 800 kW = 800000 W.
2) Compute base current I_load using formula:
Compute denominator: 1.73205 × 480 × 0.90 = 748.32; therefore I_load ≈ 800000 / 748.32 ≈ 1,069 A.
3) Apply diversity by category (more accurate than aggregate DF). Compute currents per category first:
- Motors 400 kW → I_motors = 400000 / (1.73205 × 480 × 0.90) ≈ 535 A; with DF_motors = 0.7 → I_motors_demand = 374.5 A.
- HVAC 200 kW → I_HVAC = 200000 / (748.32) ≈ 267.3 A; with DF_HVAC = 0.85 → I_HVAC_demand = 227.2 A.
- Lighting 150 kW → I_light = 200.9 A; DF_light = 0.9 → I_light_demand = 180.8 A.
- Aux 50 kW → I_aux = 66.98 A; DF_aux = 0.8 → I_aux_demand = 53.6 A.
4) Sum I_demanded = 374.5 + 227.2 + 180.8 + 53.6 = 836.1 A.
I_future = I_demanded × (1 + GM) = 836.1 × 1.25 = 1,045.1 A.
6) Apply temperature and harmonic corrections:
I_corrected = I_future / (T_corr × HCF) = 1,045.1 / (0.91 × 0.95) = 1,045.1 / 0.8645 ≈ 1,209 A.
7) Select standard bus rating: nearest standard rating ≥ 1,209 A → 1,200 A is marginally less; choose 1,600 A bus for safety and future headroom. Document justification: 1,600 A bus provides additional margin (~32% over corrected current).
Short-circuit check
- Obtain utility fault level or compute I_sc at MDP. Example: available fault = 25 kA.
- Verify bus and switchgear mechanical/thermal withstand for 25 kA RMS symmetrical 1 s. Select switchgear with rating ≥ 25 kA; typical 25 kA or 65 kA devices are available.
Result and selection
- Recommended MDP bus rating: 1,600 A, 480 V, three-phase, rated 25 kA symmetrical or higher.
- Conductor and busbar: size main feeders per device terminals for 1,600 A continuous — coordinate with manufacturer tables (e.g., copper busbars with cross-section ~300–400 mm2 depending on design and cooling).
- Rationale documented: demand diversity, 10-year growth margin, ambient derating, harmonic factor, and short-circuit verification.
Real case study 2 — Data center main distribution with N+1 redundancy
Project data and assumptions
- Facility: 2 MW IT load at 400 V LV distribution fed through MDP and UPS modules.
- P_total IT = 2000 kW. UPS efficiency considered 96% (UPS losses increase upstream currents slightly).
- PF for IT loads approximate 0.99 (near unity), but UPS and inrush behavior matters for diversity.
- Redundancy strategy: N+1 supply trains where the MDP must support full critical load with one UPS offline only if bypass allowed; otherwise bus must support full IT load.
- GM = 30% for 10–12 year growth horizon due to rack additions.
- Ambient temperature inside electrical room 30°C: T_corr = 0.96.
- Harmonics: high non-linear load content → HCF = 0.85 (conservative).
Computation steps
1) Account for UPS losses: P_total_upstream = P_IT / Efficiency = 2,000 kW / 0.96 ≈ 2,083.33 kW.
I_load = 2,083,333 / (1.73205 × 400 × 0.99) ; denominator = 1.73205 × 400 × 0.99 = 685.1; I_load ≈ 2,083,333 / 685.1 ≈ 3,041 A.
3) Apply demand factors: for data centers, DF typically 0.7–0.9 depending on power distribution strategy. Use DF = 0.9 (conservative because racks often loaded).
I_demanded = 3,041 × 0.9 = 2,737 A.
I_future = 2,737 × 1.30 = 3,558 A.
5) Apply correction factors:
I_corrected = I_future / (T_corr × HCF) = 3,558 / (0.96 × 0.85) = 3,558 / 0.816 = 4,362 A.
6) Select standard bus rating: nearest standard ≥ 4,362 A → choose 4,000 A is insufficient; select 5,000 A or 4,000 A with parallel bus configurations. Practical choice: 5,000 A bus or two 3,000 A buses in parallel rated and protected appropriately. Manufacturer availability and breaker ratings must be verified.
Short-circuit and component checks
- Obtain utility short-circuit level — example 40 kA at MDP. Select switchgear rated for at least 40 kA, or design external protections to limit currents.
- Ensure busbars and joints account for harmonic heating and DC offset if rectifiers present.
Result and recommendations
- Recommended MDP bus rating: 5,000 A, or parallel busway arrangement with protective coordination to achieve effective 5,000 A capacity.
- Consider modular busway systems to allow incremental growth with lower initial expenditure and improved thermal dissipation.
- Perform harmonic studies (per IEEE 519) and thermal modeling for bus ducts to confirm HCF assumptions; adjust bus or cooling as required.
Verification steps and compliance with standards
Standards and normative references to consult
- NFPA 70 (National Electrical Code) — general sizing, demand factors, and conductor ampacity guidance: https://www.nfpa.org/
- IEC 61439-1 and -2 — low-voltage switchgear and controlgear assemblies requirements: https://www.iec.ch/
- IEEE Std 1584 — Guide for arc flash calculations and short-circuit analysis: https://standards.ieee.org/
- IEEE C37 series — switchgear and breaker standards for interrupting ratings and testing: https://standards.ieee.org/
- IEC 60364 — electrical installations for buildings (national adoption varies).
- IEEE 519 — limits and measurement of harmonics in power systems (harmonic study guidance): https://standards.ieee.org/
Checklist for verification and documentation
- Document all load nameplate data, assumption of power factor, and demand factors with references.
- Record growth margin GM and provide justification for planning horizon.
- List all correction factors applied (ambient temperature, grouping, harmonic derating) and their sources.
- Retain utility short-circuit calculations and confirm I_sc at MDP bus supply point.
- Verify selected bus and switchgear interrupting capacity and mechanical withstand are ≥ I_sc and per applicable test standards.
- Perform coordination study for overcurrent protection devices and arc flash evaluation per IEEE 1584.
- Include commissioning current measurements and thermal imaging to validate design assumptions and adjust if actual load profile deviates significantly.
Practical tips for instant calculator implementation and user experience
- Pre-populate load categories and template demand factors for common facility types (industrial, commercial, data center) to accelerate input.
- Allow toggles for growth margin presets (5, 10, 20, 30%) with automatic documentation of planning horizon rationale.
- Include an interactive short-circuit calculator input for utility source impedance or fault MVA to derive I_sc for verification steps.
- Implement harmonic study flags: if nonlinear loads > 20% of total, automatically suggest HCF and recommend detailed harmonic analysis per IEEE 519.
- Exportable report: include inputs, intermediate calculations, selected bus rating, device ratings, and normative references for design review and permitting.
Common pitfalls and how to avoid them
- Underestimating diversity: failing to use appropriate DF can oversize or undersize the bus; always justify DF with code, measurement, or engineering judgement.
- Neglecting temperature correction: high ambient can reduce allowable ampacity—always address enclosure ventilation and ambient.
- Ignoring harmonics: non-linear loads cause additional heating—perform harmonic analysis when loads include rectifiers, UPSs, VFDs.
- Selecting bus rating purely by incremental cost: choose rating to allow switching and maintenance operations safely without overloading during contingencies.
- Overlooking short-circuit ratings: selecting a bus or breaker with insufficient breaking capacity is unsafe and non-compliant.
Appendix: Additional formulas and conductor selection guidance
Single-line conductor sizing for continuous duty
A common check: choose conductor ampacity ≥ 125% of the continuous load per many codes when feeding continuous loads.
Where I_continuous = I_corrected if the load is continuous. Example: if I_corrected = 1,209 A (from case study 1), conductor ampacity must be ≥ 1,511 A. Choose parallel conductors or larger cable group accordingly and account for allowable terminal limits.
Short-circuit current basic relation
Where Z_th = source + transformer + feeder impedance. Use symmetrical components for accurate fault current distribution and consult utility data or perform full system Y-bus fault study.
References and further reading
- NFPA — National Fire Protection Association (NEC): https://www.nfpa.org/
- IEC — International Electrotechnical Commission (IEC 61439 series): https://www.iec.ch/
- IEEE Standards — IEEE 1584, IEEE 519, and the C37 family: https://standards.ieee.org/
- NEMA — National Electrical Manufacturers Association for switchgear and busway guidance: https://www.nema.org/
- Manufacturer technical datasheets for busbar ampacity and switchgear interrupting ratings (e.g., Schneider Electric, Siemens, ABB).