SAIDI = Σ(rᵢ × Nᵢ) ÷ Nₜ · SAIFI = Σ(Nᵢ) ÷ Nₜ · CAIDI = SAIDI ÷ SAIFI📊 Benchmark Reference
| Performance | SAIDI (min) | SAIFI | CAIDI (min) |
|---|---|---|---|
| Top quartile | < 60 | < 0.8 | < 80 |
| US median | ~110 | ~1.1 | ~100 |
| Bottom quartile | > 200 | > 1.5 | > 150 |
SAIDI, SAIFI, and CAIDI are the three core electrical reliability indices defined in IEEE Standard 1366. They quantify how often and how long customers experience power outages—information that regulators, utilities, and industrial reliability engineers use to benchmark grid performance, set improvement targets, and justify capital investments. SAIDI measures the average total outage duration per customer, SAIFI measures how many times the average customer is interrupted, and CAIDI measures how long each interruption lasts on average. Together, these indices give a complete picture of distribution-system reliability.
Whether you are preparing a regulatory filing, analyzing your feeder performance, or comparing your utility against industry benchmarks, the calculator above lets you compute all three indices instantly from summary outage data. Read on for the full IEEE 1366 formulas, a benchmark reference table, and six worked examples ranging from small rural cooperatives to large metropolitan utilities.
Reliability Benchmark Table — SAIDI, SAIFI & CAIDI by Region
The table below compares typical reliability performance across different utility environments. All values exclude Major Event Days (MEDs) per IEEE 1366-2022 methodology. Source data is based on published regulatory filings and IEEE benchmarking surveys.
| Utility Type / Region | SAIDI (min/cust/yr) | SAIFI (int/cust/yr) | CAIDI (min/int) | Notes |
|---|---|---|---|---|
| Top-quartile US urban | 35–60 | 0.5–0.8 | 60–80 | Underground networks, automation |
| US national median | 100–120 | 1.0–1.2 | 90–110 | Mix of overhead & underground |
| US rural cooperative | 150–300 | 1.3–2.0 | 100–160 | Long feeders, sparse tree trimming |
| Western Europe (avg) | 30–70 | 0.3–0.7 | 60–100 | Underground-heavy, mature grids |
| Japan | 10–20 | 0.1–0.2 | 50–80 | Extreme reliability investment |
| Latin America (avg) | 200–600 | 1.5–4.0 | 100–200 | Overhead feeders, limited automation |
| Sub-Saharan Africa | 500–2,000+ | 3.0–10.0+ | 150–300+ | Generation deficits, aging infrastructure |
These benchmarks help you put your calculated indices in context. A SAIDI of 120 minutes is roughly average for US utilities but would be considered poor in Japan or Western Europe. Regulators in many US states set performance targets at the first-quartile level and impose penalties for utilities that exceed the third-quartile threshold.
SAIDI, SAIFI & CAIDI Formulas — Step by Step
All three indices are defined in IEEE Standard 1366 (Guide for Electric Power Distribution Reliability Indices). They use data from a utility’s Outage Management System (OMS). Here are the formulas, what each variable means, and a quick numerical example for each.
SAIDI — System Average Interruption Duration Index
What it measures: The average total minutes of interruption experienced by each customer served during the reporting period (typically one year). A SAIDI of 120 means the average customer was without power for a cumulative total of 2 hours over the year.
Variables: rᵢ = restoration time (minutes) for interruption event i · Nᵢ = number of customers interrupted by event i · Nₜ = total number of customers served by the utility.
Quick example: A utility serves 100,000 customers. Over the year, total customer-minutes of interruption = 12,000,000. SAIDI = 12,000,000 ÷ 100,000 = 120 min/customer/year.
SAIFI — System Average Interruption Frequency Index
What it measures: How many times the average customer experiences a sustained interruption (lasting > 5 minutes per IEEE 1366) during the reporting period. A SAIFI of 1.2 means the average customer was interrupted 1.2 times that year.
Quick example: Same utility, 100,000 customers. Total customer interruptions over the year = 110,000. SAIFI = 110,000 ÷ 100,000 = 1.10 interruptions/customer/year.
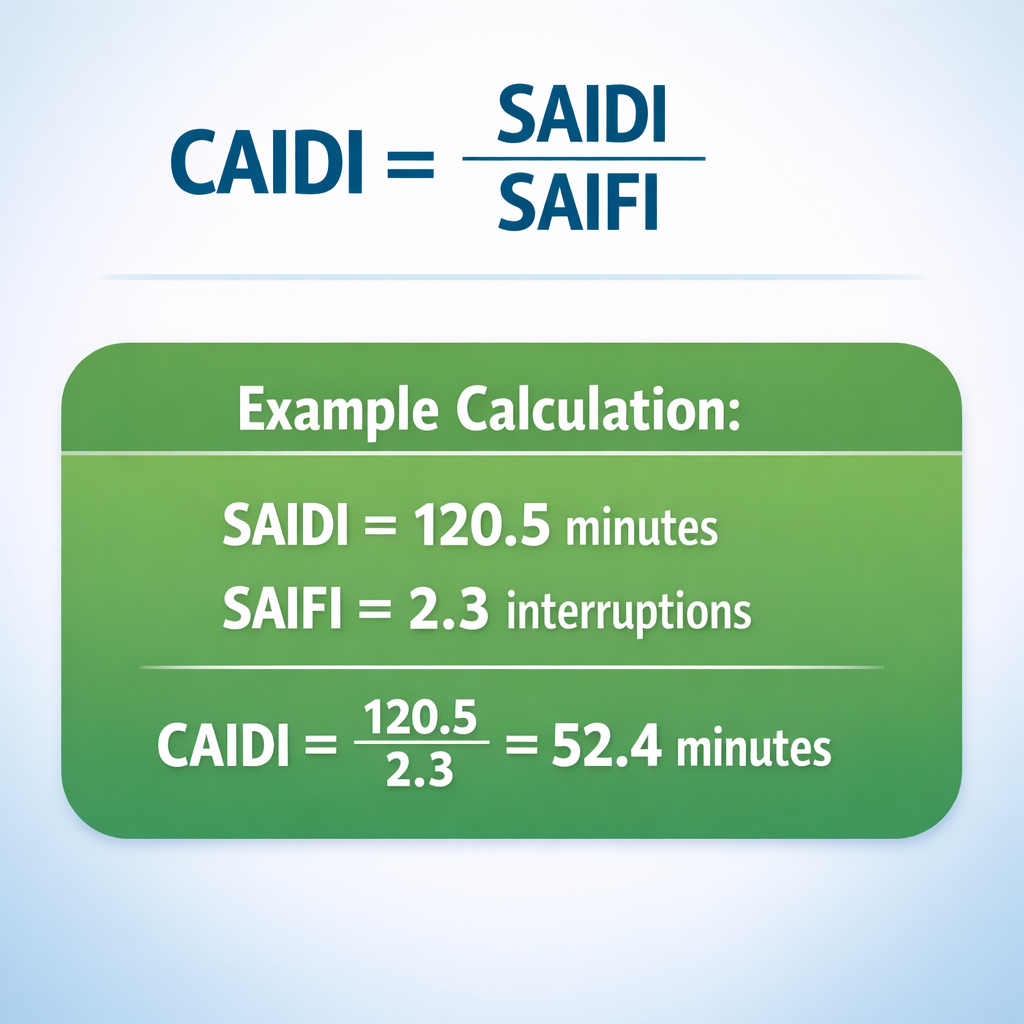
CAIDI — Customer Average Interruption Duration Index
What it measures: The average duration of each interruption event as experienced by a customer. It answers: “When the lights go out, how long until they come back?” A CAIDI of 90 means each outage lasted 90 minutes on average.
Quick example: SAIDI = 120 min, SAIFI = 1.10. CAIDI = 120 ÷ 1.10 = 109.09 min/interruption.
Index Comparison — What Each Measures
Each reliability index answers a different question. The table below clarifies the distinction and shows how they relate to each other mathematically and operationally.
| Index | Full Name | Unit | Question It Answers | Improved By |
|---|---|---|---|---|
| SAIDI | System Average Interruption Duration Index | min/cust/yr | How long was the average customer without power? | Faster restoration, automation, crew staging |
| SAIFI | System Average Interruption Frequency Index | int/cust/yr | How often was the average customer interrupted? | Tree trimming, animal guards, reclosers |
| CAIDI | Customer Average Interruption Duration Index | min/int | When the lights go out, how long do they stay out? | FLISR, mobile substations, sectionalizing |
| MAIFI | Momentary Average Interruption Frequency Index | events/cust/yr | How often do brief (< 5 min) outages occur? | Upgraded reclosers, lightning arresters |
| ASAI | Average Service Availability Index | % (decimal) | What fraction of the year was power available? | All of the above |
Note that CAIDI = SAIDI ÷ SAIFI. This means a utility can have a low SAIDI (few total outage minutes) but a high CAIDI if outages are infrequent but long. Conversely, a utility with frequent short blips will show a high SAIFI but low CAIDI. Regulators typically track SAIDI and SAIFI as the primary accountability metrics, because CAIDI alone can be misleading.
Related Indices — MAIFI, ASAI & ENS
Beyond the three core indices, IEEE 1366 and IEC 61000 define several supplementary metrics that round out the reliability picture.
MAIFI (Momentary Average Interruption Frequency Index): Counts interruptions lasting less than 5 minutes (or less than 1 minute in some jurisdictions). These “blinks” don’t appear in SAIFI but still disrupt sensitive industrial processes, data centers, and CNC machinery. IMᵢ is the number of customers experiencing momentary event i.
ASAI (Average Service Availability Index): Expresses reliability as a percentage of the total minutes in a year (525,600). A SAIDI of 120 min gives ASAI = 1 − (120 ÷ 525,600) = 0.999772, or 99.977 % availability. Utilities in Japan routinely exceed 99.99 %.
ENS (Energy Not Supplied): Multiplies the average load interrupted (kW) by the duration to give the total energy lost in kWh. This is especially relevant for economic analysis, where the Value of Lost Load (VoLL) in $/kWh is applied to estimate the cost of unreliability to customers and the economy.
6 Solved Examples — SAIDI, SAIFI & CAIDI Calculations
Example 1 — Small Urban Utility (Single-Year Summary)
Data: Nₜ = 50,000 customers · Σ(rᵢ × Nᵢ) = 4,500,000 cust-min · Σ(Nᵢ) = 45,000 cust-int
SAIDI: 4,500,000 ÷ 50,000 = 90.00 min/cust/yr
SAIFI: 45,000 ÷ 50,000 = 0.9000 int/cust/yr
CAIDI: 4,500,000 ÷ 45,000 = 100.00 min/int
This utility performs in the top quartile for SAIDI and SAIFI by US standards. The 100-minute CAIDI suggests that when outages do occur, restoration takes about 1 hour 40 minutes—typical for an urban system with moderate automation.
Example 2 — Large Metropolitan Utility
Data: Nₜ = 500,000 customers · Σ(rᵢ × Nᵢ) = 25,000,000 cust-min · Σ(Nᵢ) = 350,000 cust-int
SAIDI: 25,000,000 ÷ 500,000 = 50.00 min/cust/yr
SAIFI: 350,000 ÷ 500,000 = 0.7000 int/cust/yr
CAIDI: 25,000,000 ÷ 350,000 = 71.43 min/int
Excellent reliability, consistent with a heavily underground metropolitan network with FLISR (Fault Location, Isolation, and Service Restoration) automation. This utility would rank in the top quartile nationally.
Example 3 — Rural Electric Cooperative
Data: Nₜ = 8,000 customers · Σ(rᵢ × Nᵢ) = 2,400,000 cust-min · Σ(Nᵢ) = 14,400 cust-int
SAIDI: 2,400,000 ÷ 8,000 = 300.00 min/cust/yr
SAIFI: 14,400 ÷ 8,000 = 1.8000 int/cust/yr
CAIDI: 2,400,000 ÷ 14,400 = 166.67 min/int
Typical for a rural co-op with long overhead feeders through forested terrain. SAIDI of 5 hours and CAIDI of nearly 3 hours reflect long travel times to fault locations and limited crew availability. Tree trimming and recloser upgrades would have the greatest impact.
Example 4 — Event-Level Calculation (3 Outage Events)
Data: Nₜ = 20,000 customers
Event A: 500 customers × 120 min = 60,000 cust-min
Event B: 200 customers × 45 min = 9,000 cust-min
Event C: 1,000 customers × 180 min = 180,000 cust-min
Σ(rᵢ × Nᵢ) = 249,000 · Σ(Nᵢ) = 1,700
SAIDI: 249,000 ÷ 20,000 = 12.45 min/cust/yr
SAIFI: 1,700 ÷ 20,000 = 0.0850 int/cust/yr
CAIDI: 249,000 ÷ 1,700 = 146.47 min/int
With only three events over the year, SAIDI and SAIFI are very low, but CAIDI is high because each event that did occur lasted a long time. This pattern is common in systems with few faults but difficult-to-access lines (e.g., mountainous terrain).
Example 5 — ASAI from SAIDI
Data: SAIDI = 120 min/cust/yr
Formula: ASAI = 1 − (SAIDI ÷ 525,600)
Calculation: ASAI = 1 − (120 ÷ 525,600) = 1 − 0.000228 = 0.999772 (99.977 %)
A SAIDI of 120 minutes still yields “three nines” availability. To reach “four nines” (99.99 %), SAIDI would need to be below 52.56 minutes—achievable only by top-performing urban utilities with extensive underground networks and automation.
Example 6 — MAIFI Calculation
Data: Nₜ = 100,000 customers · Total customers experiencing momentary interruptions = 250,000
Formula: MAIFI = Σ(IMᵢ) ÷ Nₜ
Calculation: MAIFI = 250,000 ÷ 100,000 = 2.50 events/cust/yr
Each customer experienced an average of 2.5 momentary interruptions (blinks). These don’t appear in SAIFI but still trip sensitive industrial equipment. Upgrading reclosers from hydraulic to electronic and installing lightning arresters typically reduces MAIFI by 30–50 %.
Practical Applications of Reliability Indices
Reliability indices are not just academic metrics—they drive real investment decisions, regulatory compliance, and operational strategy across the electric power industry.
Regulatory compliance: In the US, most state public utility commissions (PUCs) require annual filings of SAIDI and SAIFI. Many states set performance targets and can impose financial penalties or require corrective action plans when a utility exceeds its threshold. For example, a state may set a SAIDI target of 150 minutes; a utility reporting 180 minutes faces scrutiny and potential rate-case consequences.
Capital investment prioritization: Utilities use feeder-level SAIDI and SAIFI to identify the “worst-performing circuits” (WPCs) and direct capital toward those feeders first. Typical improvements include installing sectionalizing reclosers, replacing bare overhead conductor with covered wire, and deploying FLISR automation—each of which directly lowers SAIDI by reducing restoration time.
Industrial reliability planning: Factories, data centers, and hospitals use the utility’s published SAIDI and SAIFI to determine whether backup power (UPS, generators) is needed. If SAIDI is 200 min/year and a data center requires 99.999 % uptime, the gap must be filled with on-site redundancy. See our UPS Sizing Calculator for related calculations.
Benchmarking and reporting: Industry groups (EEI, APPA, NRECA) publish annual reliability reports that allow utilities to compare their performance against peers. Internal benchmarking between service regions or between years helps measure the effectiveness of vegetation management, storm hardening, and automation programs.
For related power-system engineering tools, see our Fault Current (AIC) Calculator, Arc Flash Calculator (IEEE 1584), and Balanced & Unbalanced Load Calculation.
Quick Equivalencies — Common SAIDI/SAIFI/CAIDI Queries
SAIFI Formula
SAIFI = Σ(Nᵢ) ÷ Nₜ
Sum of all customers interrupted (across all events) divided by total customers served. Unit: interruptions/customer/year. Defined in IEEE 1366.
SAIDI Formula
SAIDI = Σ(rᵢ × Nᵢ) ÷ Nₜ
Sum of all customer-minutes of interruption divided by total customers served. Unit: minutes/customer/year. The most-watched utility reliability metric.
CAIDI Formula
CAIDI = SAIDI ÷ SAIFI
Average duration per interruption. Equivalently: Σ(rᵢ × Nᵢ) ÷ Σ(Nᵢ). Unit: minutes/interruption.
SAIDI Full Form
System Average Interruption Duration Index
Defined in IEEE Standard 1366-2022. Measures average total outage minutes per customer per reporting period.
SAIFI Full Form
System Average Interruption Frequency Index
Counts sustained interruptions (typically > 5 minutes). Excludes momentary events, which are tracked by MAIFI.
CAIDI Full Form
Customer Average Interruption Duration Index
Answers: “Once the lights go out, how long until they come back on?” Higher CAIDI = slower restoration.
MAIFI Formula
MAIFI = Σ(IMᵢ) ÷ Nₜ
Momentary Average Interruption Frequency Index. Counts brief outages (< 5 min) that don’t appear in SAIFI but still trip sensitive loads.
SAIDI SAIFI Calculation Example
See Example 1 above
50,000 customers, 4.5 M cust-min, 45,000 cust-int → SAIDI = 90, SAIFI = 0.90, CAIDI = 100.
SAIDI SAIFI
Duration vs. Frequency
SAIDI measures total outage time; SAIFI measures how many times outages happen. Both are needed for a complete reliability picture.
SAIDI Calculation
Σ(rᵢ × Nᵢ) ÷ Nₜ
Multiply each event’s duration (minutes) by customers affected, sum all events, divide by total customers. Use the calculator at the top of this page.
Frequently Asked Questions — SAIDI, SAIFI & CAIDI
What is SAIDI and what does it measure?
SAIDI stands for System Average Interruption Duration Index. It measures the average total minutes that each customer served is without power during a reporting period (usually one year). A SAIDI of 120 means the average customer experienced 2 hours of cumulative outage time. Formula: SAIDI = Σ(rᵢ × Nᵢ) ÷ Nₜ.
What is SAIFI and how is it calculated?
SAIFI stands for System Average Interruption Frequency Index. It counts how many sustained interruptions (> 5 minutes) the average customer experiences per year. Formula: SAIFI = Σ(Nᵢ) ÷ Nₜ. A SAIFI of 1.2 means the average customer was interrupted 1.2 times that year.
What is CAIDI?
CAIDI stands for Customer Average Interruption Duration Index. It equals SAIDI divided by SAIFI and tells you the average duration of each interruption. A CAIDI of 100 means each outage lasted about 1 hour and 40 minutes on average before power was restored.
What is a good SAIDI value?
Below 60 minutes per customer per year is considered top-quartile in the United States. The US median is roughly 100–120 minutes. Japanese utilities achieve SAIDI below 20 minutes—among the best in the world—due to massive investment in underground cables and automation.
What is a good SAIFI value?
Below 0.8 interruptions per customer per year is top-quartile in the US. The median is about 1.0–1.2. Western European utilities often achieve SAIFI below 0.5 thanks to extensive underground distribution networks.
What is the relationship between SAIDI, SAIFI, and CAIDI?
CAIDI = SAIDI ÷ SAIFI. If you know any two, you can calculate the third. SAIDI and SAIFI are independent measurements from outage data; CAIDI is derived from them. Regulators usually track SAIDI and SAIFI directly.
What is MAIFI?
MAIFI stands for Momentary Average Interruption Frequency Index. It counts brief interruptions lasting less than 5 minutes (or less than 1 minute in some standards). Formula: MAIFI = Σ(IMᵢ) ÷ Nₜ. These “blinks” are excluded from SAIFI but still disrupt sensitive industrial loads.
What does IEEE 1366 cover?
IEEE 1366-2022 is the Guide for Electric Power Distribution Reliability Indices. It defines SAIDI, SAIFI, CAIDI, MAIFI, ASAI, CEMI, and other metrics, plus the Major Event Day (MED) exclusion methodology using the 2.5-beta method. It is the worldwide standard for utility reliability reporting.
How do you convert SAIDI to availability (ASAI)?
ASAI = 1 − (SAIDI ÷ 525,600). There are 525,600 minutes in a non-leap year. A SAIDI of 120 minutes gives ASAI = 0.999772, or 99.977 % availability. To reach 99.99 % (“four nines”), SAIDI must be below 52.56 minutes.
What is a Major Event Day (MED) and why does it matter?
A Major Event Day is defined by IEEE 1366 as any day where the daily SAIDI exceeds a statistical threshold (T_MED) calculated using the 2.5-beta method on historical data. MEDs—typically caused by hurricanes, ice storms, or tornados—are excluded from the annual SAIDI and SAIFI to avoid distorting the baseline reliability trend.
Can SAIDI and SAIFI be calculated per feeder?
Yes. Feeder-level SAIDI and SAIFI are essential for identifying worst-performing circuits (WPCs). The formulas are the same, but Nₜ becomes the number of customers on that feeder. Most utilities rank feeders by contribution to system SAIDI and target the top 10 for capital improvements each year.
How do reliability indices affect electricity rates?
Many regulators tie reliability performance to rate adjustments. A utility exceeding its SAIDI/SAIFI target may face penalties or be required to increase capital spending on reliability improvements. Conversely, utilities outperforming targets may earn performance incentives—effectively rewarding lower outage rates with higher allowed returns.
Related Calculators
Explore more power-system engineering tools on our site:
- Fault Current (AIC) Calculator — determine available fault current for panel labeling.
- Arc Flash Calculator (IEEE 1584) — compute incident energy for PPE selection.
- UPS Sizing Calculator — size uninterruptible power supplies for servers and critical loads.
- Amps to kW Calculator — convert motor current to electrical power.
- Motor Efficiency Calculator — input vs. output power with loss breakdown.
- Balanced & Unbalanced Load Calculation — three-phase load distribution.
- Amps to Watts Calculator — single-phase and three-phase conversions.