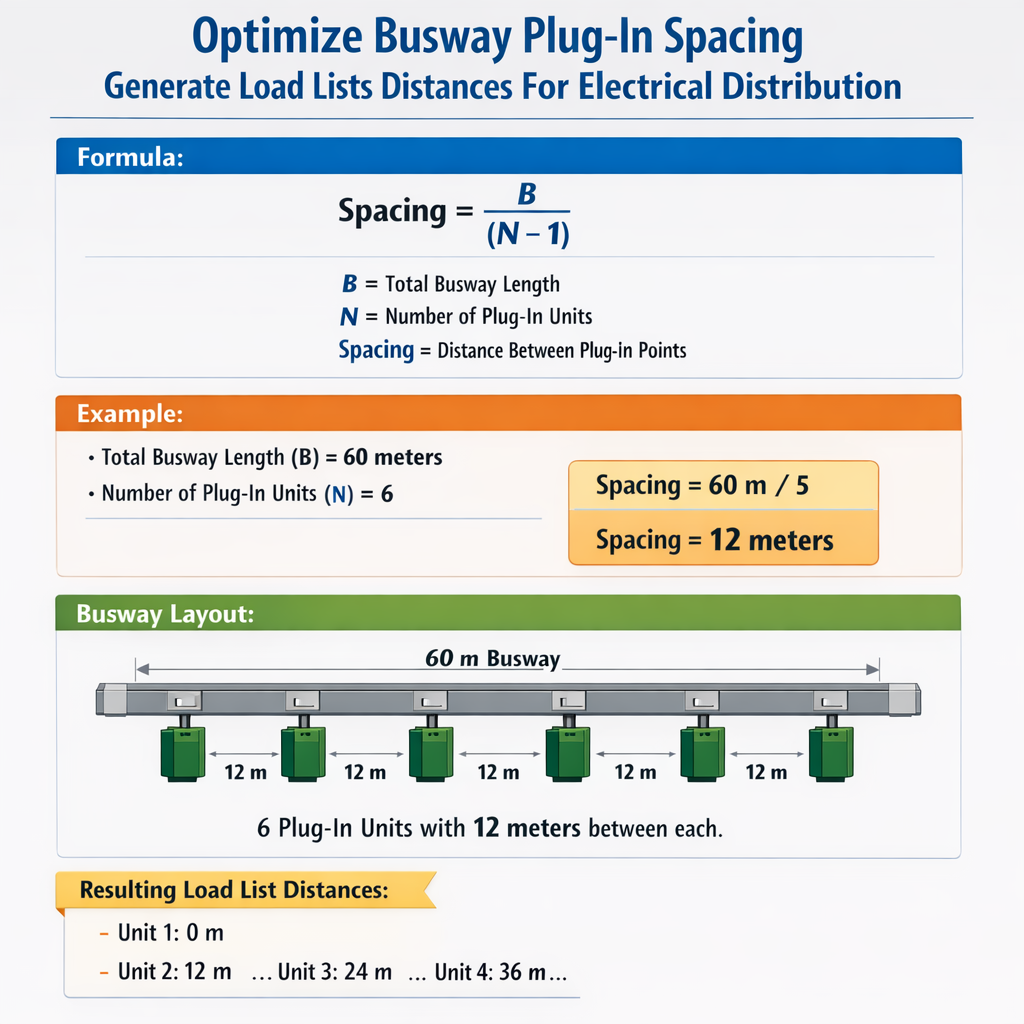
Optimize busway plug in spacing to balance load capacity, thermal limits, and operational system reliability.
Generate accurate load lists and distances to ensure compliant electrical distribution and minimize voltage drop.Busway Plug-In Spacing Optimizer and Load Distance List (3‑Phase Distribution)
Busway plug-in spacing: technical drivers and electrical distribution impact
Busbar trunking systems (busways) provide a continuous conductor path with modular plug-in points. Plug-in spacing directly affects: thermal rating distribution, short-circuit stress, fault current distribution, electrical losses (voltage drop), and maintainability. Placing tap-off units too close without capacity headroom leads to localized overheating and early derating; spacing that is too large can create long lateral runs that increase voltage drop for remote loads.Optimization requires simultaneously generating accurate load lists, modeling distance-dependent impedance, and applying demand/diversity factors. The goal is to map plug-in spacing and allowable tap ratings such that the busway operates within thermal limits, voltage drop guidelines, and applicable standards while minimizing installation and operational cost.Types of busway and relevant electrical parameters
Common busway constructions and implications for spacing
- Low-voltage copper/aluminum sectional busways: higher conductivity, lower resistance per unit length. - Segmented insulated phase busbars versus enclosed multi-section busway: different cooling and thermal dissipation characteristics. - Factory-rated tap accessibility and maximum tap sizes per manufacturer: determine allowable in-line tap current at specific locations.Key electrical parameters for spacing decisions:- Conductor resistance per unit length R (Ω/m)
- Conductor reactance per unit length X (Ω/m)
- Thermal rating (A) per continuous segment
- Maximum short-circuit withstand and its effect on protective device selection
- Tap-off device rating and permissible number of taps per busway section
Practical tables: typical ampacity, resistance, and demand values
| Busbar Cross-section (mm²) | Copper R (Ω/m) approx. | Aluminium R (Ω/m) approx. | Typical Continuous Ampacity (A) | Suggested Max Tap Rating per Tap (A) |
|---|---|---|---|---|
| 80 | 0.000216 | 0.000353 | 160–210 | 63–100 |
| 120 | 0.000144 | 0.000235 | 210–260 | 100–125 |
| 185 | 0.000093 | 0.000152 | 260–350 | 125–200 |
| 240 | 0.000072 | 0.000118 | 350–450 | 200–320 |
| 300 | 0.000057 | 0.000094 | 450–600 | 320–400 |
| Load Type | Typical Unity/Demand Factor | Application Guidance |
|---|---|---|
| Motors (individual) | 1.0 (at FLA) for feeder selection | Use motor FLA; apply diversity only for groups per standard methods |
| Multiple motors in plant | 0.7–0.9 | Apply diversity per IEC/NEC guidance depending on simultaneity |
| Lighting | 0.6–0.9 | Use occupancy and control provisions; consider separate lighting bus |
| Heating loads | 1.0 | Resistive loads usually nondiscretionary |
| IT / Rack PDUs | 0.5–0.9 | Use measured or vendor-specified duty cycles and diversity |
Methodology to generate load lists and spatial distances
1. Inventory: Enumerate each tap location, load type, rated power (kW), power factor, and expected simultaneity. 2. Map physical distances from the origin of the busway to each tap (in meters). Use the centerline distance along the busway trunk. 3. Group taps by contiguous sections to calculate cumulative currents in each bus element. 4. Apply demand/diversity factors where standards permit, but treat motors and continuous loads distinctly. 5. Determine protective device ratings at each tap and verify coordination. 6. Compute voltage drop and conductor temperature rise for the worst-case loading scenario (most remote tap under maximum expected load).Load list example structure
- Tap ID
- Distance from busway origin (m)
- Load type (motor, lighting, PDU, HVAC)
- Rated power or current
- Power factor (cosφ)
- Demand factor or simultaneity assumption
- Tap device rating
Formulas and variable definitions for electrical calculations
Voltage drop for three-phase systems: V_drop = √3 × I × (R × cosφ + X × sinφ) × LPercentage voltage drop: V_drop% = (V_drop / V_ll) × 100Where:- V_drop = line-to-line voltage drop (V)
- √3 = square root of 3 (approx. 1.732)
- I = line current (A) for the feeder section being evaluated
- R = resistance per unit length of the bus conductor (Ω/m)
- X = reactance per unit length of the bus conductor (Ω/m)
- cosφ = power factor (dimensionless)
- sinφ = sqrt(1 - cos²φ) (dimensionless)
- L = one-way length from supply to tap (m)
- V_ll = nominal line-to-line voltage (V), e.g. 400 V or 480 V
- P_loss_per_m = total three-phase active power loss per meter (W/m)
- 3 accounts for three phases in balanced system
- I_sc = short-circuit current seen at tap (A)
- Z_th_total = total per-phase impedance from source through busway to tap (Ω)
- R (copper 185 mm²) ≈ 0.000093 Ω/m
- X for compact busway sections typically ranges 0.05–0.2 × R (depends on geometry) — use manufacturer data
- Power factor cosφ often 0.8–1.0 depending on loads
Example calculations — Case Study 1: Industrial plant motor cluster
Scenario:- System voltage: 480 V three-phase
- Busbar: copper, 185 mm² (R ≈ 0.000093 Ω/m, X assume 0.000020 Ω/m)
- Busway length: 40 m to the farthest tap
- Loads tapped along the busway:
- Tap A at 10 m: Motor M1, 50 HP, efficiency 92%, cosφ = 0.9
- Tap B at 25 m: Motor M2, 30 HP, efficiency 90%, cosφ = 0.88
- Tap C at 40 m: Motor M3, 10 HP, efficiency 88%, cosφ = 0.85 and lighting 5 kW at same tap
Example calculations — Case Study 2: Data center aisle with distributed PDUs
Scenario:- System voltage: 400 V three-phase (Europe-style 400Y/230 V)
- Busbar: copper, 240 mm² (R ≈ 0.0000718 Ω/m, X assume 0.000015 Ω/m)
- Busway total run: 60 m
- Planned tap layout: 30 rack PDUs evenly spaced every 2 m, each PDU rated 32A at 400 V three-phase with expected average load per PDU 20 A (diversity expected)
- Use 300 mm² copper bus to maintain ampacity and low voltage drop.
- Maintain 2 m spacing for mechanical convenience, but verify manufacturer permitted tap density.
- Provide selective coordination for rack-level breakers and PDUs; use energy management to reduce diversity uncertainty.
Optimization strategies for plug-in spacing and cost-effective distribution
- Match tap spacing to load density: tighter spacing in high-density zones (IT racks) enables shorter patch leads but increases number of taps and associated cost; consider intermediate PDUs. - Use hierarchical distribution: main busway supplies sub-bus sections or feeder panels; place larger taps for grouped loads to reduce number of tap connections. - Implement demand management and monitoring to refine actual simultaneity and reduce conservative over-sizing. - Apply thermal imaging and instrumented logging on initial commissioning to validate design assumptions and adjust spacing or tap ratings. - Account for future growth: provision busway sections with spare capacity or reserve space for additional plug-in units.Checklist for an optimized busway plug-in design
- Create an accurate, distance-tagged load list
- Apply appropriate demand and diversity factors per load class
- Model voltage drop for the farthest tap under worst-case loading
- Verify busway continuous ampacity and tap-per-section limitations
- Coordinate protective devices and verify short-circuit levels
- Validate final design against manufacturer data and standards
Standards, normative references, and authoritative sources
Key normative references to consult:- NFPA 70® (National Electrical Code, NEC) — mandatory for installations in the United States. See: https://www.nfpa.org/NEC
- UL 857 — Standard for Busways and Associated Fittings (manufacturer component compliance). See: https://standardscatalog.ul.com/standards/en/standard_857
- IEC 61439-6 — Low-voltage switchgear and controlgear assemblies — busbar trunking systems. See: https://www.iec.ch
- IEEE Green Book (IEEE Std 142) — grounding and ampacity considerations; IEEE papers on busway and distribution practice. See: https://ieeexplore.ieee.org
- Manufacturer technical guides (Siemens, Schneider Electric, Eaton) — for specific busway impedance and tap limitations; consult the specific product datasheets.
Verification tools and testing recommendations
- Use spreadsheet-based load modeling for iterative spacing optimization; include per-segment cumulative current, impedance, and V_drop calculations. - Prefer EMTP/short-circuit analysis for projects where fault current levels may approach protective device limitations. - Commissioning tests:- Measure actual voltage drop with representative loads
- Thermal scan to detect hot spots at tap connections
- Verify torque and mechanical integrity of plug-in units
Operational and maintenance considerations
- Periodic inspection of plug-in connections is essential; ensure maintenance windows and safe-isolation procedures. - Train operations staff to avoid unauthorized tap additions that might exceed rated tap density. - Update load lists when loads change; re-evaluate spacing and tap ratings for cumulative growth. - Implement labeling and documentation at each tap: distance from origin, installed breaker rating, and permitted maximum tap rating.Final technical notes and best practices
- Always base the final design on manufacturer-provided impedance and ampacity tables; generic R and X values are useful for initial sizing but must be verified. - Prioritize voltage drop and thermal limits for the most critical loads; use hierarchical distribution when total concurrent load approaches bus capacity. - For large installations, consider redundant bus arrangements or sectionalizing switches to limit the length of continuous load on a single trunk and to improve maintainability. - Document assumptions: power factors, diversity factors, and ambient conditions so that future engineers can reproduce calculations.References- NFPA 70 (NEC) — National Electrical Code. https://www.nfpa.org/NEC
- IEC 61439-6 — Busbar trunking systems guidance. https://www.iec.ch
- UL 857 — Busway standard. https://standardscatalog.ul.com/standards/en/standard_857
- IEEE Std 141 — Power distribution practices. https://ieeexplore.ieee.org
- Manufacturer technical guides (example: Schneider Electric Busway Technical Guide). Refer to vendor datasheets for specific impedance and tap limitations.
- Produce a ready-to-use spreadsheet template for load lists, cumulative currents, and voltage-drop per segment.
- Run sensitivity analysis for different busbar sizes and spacing scenarios using your actual load data.