Understanding luminous efficacy is crucial for engineers, architects, and consultants, linking radiant power to perceived luminous output. A precise Luminous Efficacy Calculator helps evaluate lamps, LEDs, and technologies, ensuring compliance with CIE and IES.
Luminous Efficacy Calculator — lm/W (English)
Quickly convert between lumens, watts and luminous efficacy. Accessible, SEO-optimized, ready for WordPress.
What is luminous efficacy?
Which formula does this calculator use?
Lumens: Φ = E · P.
Watts: P = Φ / E.
For spectral conversions or radiant efficacy, specialized inputs are required.
Why do LED efficacies vary?
Extended Reference Tables of Common Luminous Efficacy Values
The following tables present typical luminous efficacy values for common light sources. These are reference ranges compiled from CIE standards, IEC reports, DOE (U.S. Department of Energy) studies, and peer-reviewed publications. Values may vary with manufacturer, ballast/driver quality, and operating conditions.
Table 1 – Common Light Source Efficacy Values
| Light Source Type | Typical Luminous Efficacy (lm/W) | Notes / Conditions |
|---|---|---|
| Incandescent (Standard A-lamp) | 10 – 17 | Strong infrared losses, very low efficiency |
| Halogen Incandescent | 15 – 25 | Slightly improved spectrum and temperature |
| Compact Fluorescent Lamp (CFL) | 45 – 70 | Depends on ballast efficiency |
| Linear Fluorescent T12 | 55 – 70 | Older technology, less efficient |
| Linear Fluorescent T8 | 80 – 100 | Widely used in offices, good efficacy |
| Linear Fluorescent T5 | 95 – 110 | High efficiency, compact geometry |
| High Pressure Sodium (HPS) | 85 – 150 | Very high efficacy but poor color rendering |
| Low Pressure Sodium (LPS) | 100 – 200 | Monochromatic yellow, excellent efficacy but impractical for most uses |
| Metal Halide (Quartz) | 65 – 115 | Higher CRI than HPS, reduced lifespan |
| Ceramic Metal Halide (CMH) | 80 – 120 | Better color rendering and stability |
| Mercury Vapor | 35 – 65 | Obsolete in many regions due to poor efficacy |
| White LED (2020 average) | 100 – 180 | Efficiency strongly depends on binning, optics, and thermal management |
| Laboratory LED (R&D level) | 200 – 300+ | Achieved in controlled test conditions |
| OLED Panels (current commercial) | 40 – 80 | Emerging, suitable for architectural applications |
| Daylight (reference sunlight) | ~93 | Theoretical luminous efficacy at 555 nm peak sensitivity |
Table 2 – Conversion Efficiency Factors
| Stage of Conversion | Approx. Efficiency (%) | Description |
|---|---|---|
| Electrical input to LED chip | 60 – 70 | Internal quantum efficiency |
| LED chip to package extraction | 80 – 90 | Optical extraction |
| Package to luminaire (optics + housing) | 70 – 85 | Losses in reflection, absorption, scattering |
| Complete system (driver + optics + housing) | 60 – 75 | Wall-plug efficacy of LED lighting systems |
These reference tables illustrate why luminous efficacy calculators must account not only for the intrinsic efficiency of the source but also the system-level factors (driver losses, optics, thermal dissipation).
Core Formulas for Luminous Efficacy
The Luminous Efficacy of Radiation (LER) and Luminous Efficacy of a Source (LES) are the two main calculated metrics. Both are critical for accurate lighting performance evaluation.
Formula 1 – Luminous Efficacy of Radiation (LER)
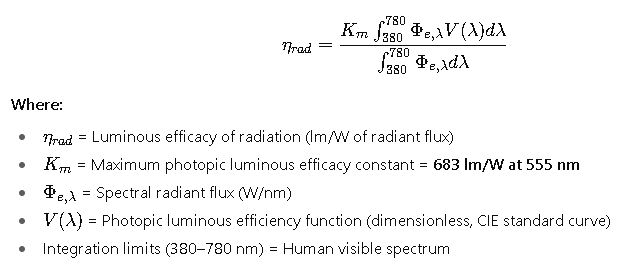
This formula expresses how efficiently a spectrum produces useful light perceived by the eye. For monochromatic green light at 555 nm, ![]() lm/W (theoretical maximum).
lm/W (theoretical maximum).
Formula 2 – Luminous Efficacy of a Source (LES)
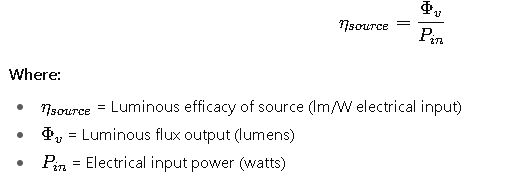
This metric reflects real-world performance, incorporating driver efficiency, ballast losses, thermal behavior, and optical design.
Formula 3 – System Wall-Plug Efficiency
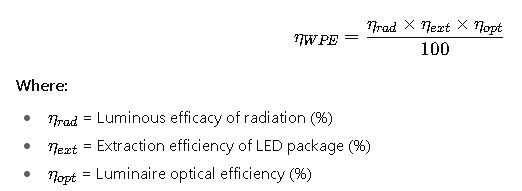
This determines how effectively electrical watts are transformed into useful lumens at the luminaire output.
Formula 4 – Photopic Conversion Example
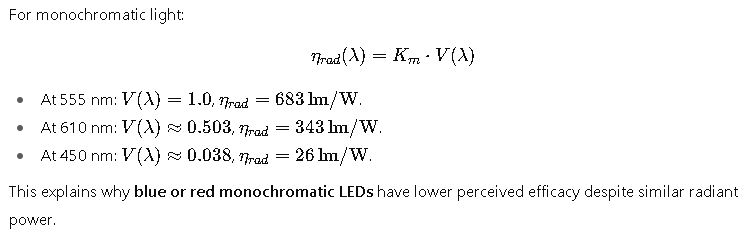
This explains why blue or red monochromatic LEDs have lower perceived efficacy despite similar radiant power.
Detailed Explanation of Key Variables in Luminous Efficacy Calculations
When working with luminous efficacy, professionals must handle several interrelated variables. Each one plays a role in determining how efficiently a light source converts electrical energy into visible light.
1. Luminous Flux (Φv)
- Definition: The total amount of light emitted by a source, measured in lumens (lm).
- Typical Values:
- A 60 W incandescent lamp: ~800 lm
- A 10 W LED lamp: ~1000 lm
- A streetlight LED module: 15,000 – 30,000 lm
- Practical Relevance: It defines how much useful light is available for human perception and tasks.
2. Radiant Flux (Φe)
- Definition: The total optical power emitted, measured in watts (W), across all wavelengths.
- Typical Values: LED packages may emit 1–10 W of radiant power for small chips.
- Key Insight: Not all radiant flux contributes to visible light; part lies outside the human visual spectrum (infrared, UV).
3. Spectral Power Distribution (SPD)
- Definition: The intensity of a light source at each wavelength across the visible spectrum.
- Importance: Determines color rendering index (CRI), correlated color temperature (CCT), and ultimately luminous efficacy.
- Examples:
- High-pressure sodium lamps have narrow, strong peaks in yellow-orange.
- LEDs can be engineered for wide or narrow SPDs depending on phosphor use.
4. Electrical Input Power (P_in)
- Definition: The total power consumed, including driver or ballast.
- Examples:
- A “10 W LED bulb” may actually draw 10.5–11 W when including driver losses.
- A fluorescent lamp with ballast may consume 20% more than its rated lamp wattage.
5. Human Visual Sensitivity Curve (V(λ))
- Definition: Standardized function describing eye sensitivity under photopic (daylight) conditions.
- Importance: Explains why some wavelengths produce much higher lumen outputs per watt of radiant power.
- Practical Example: At 555 nm (green light), the eye is most sensitive. At 700 nm (deep red), sensitivity is less than 1/10.