Efficient irrigation planning supports sustainable agriculture, improves water conservation, enhances productivity, and optimizes crop yields. Irrigation water requirement integrates climatological, agronomic, and soil parameters, providing structured calculations and reliable technical references.
Irrigation & Water Requirement Calculator
What is Kc (Crop Coefficient)?
How is irrigation water requirement calculated?
Fundamental Parameters for Irrigation Water Requirement
The irrigation requirement depends on the crop evapotranspiration (ETc), effective rainfall, soil properties, and irrigation system efficiency. The following formulas are used in practice across FAO56 guidelines, USDA Soil Conservation Service methods, and modern precision agriculture standards.
Key Formulas for Irrigation and Water Requirement Calculation
1. Reference Evapotranspiration (ET₀)
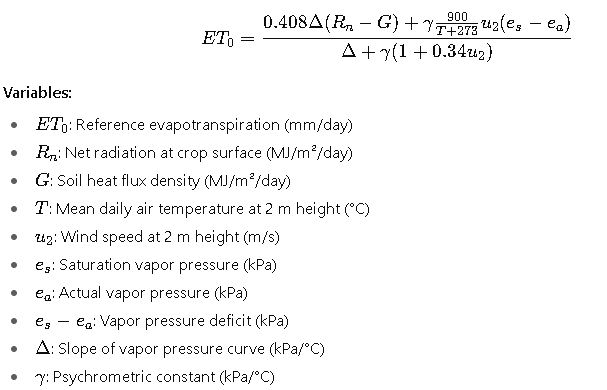
This is the FAO Penman–Monteith equation, universally adopted.
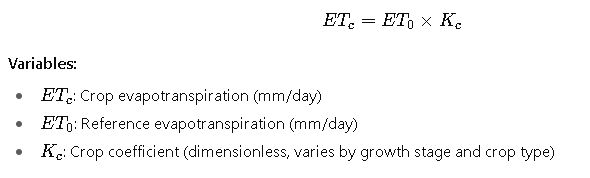
2. Crop Evapotranspiration (ETc)
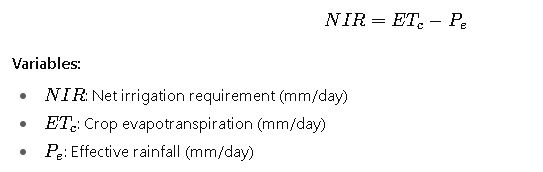
3. Net Irrigation Requirement (NIR)
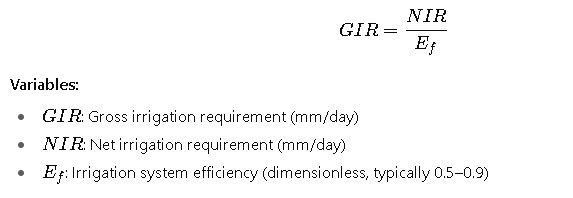
4. Gross Irrigation Requirement (GIR)
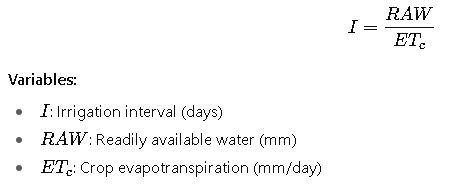
5. Irrigation Interval
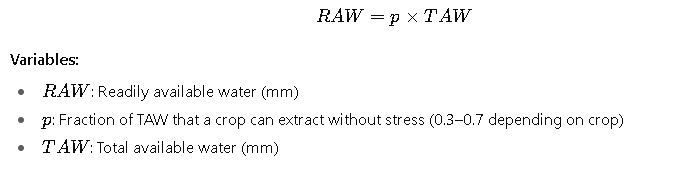
6. Readily Available Water (RAW)
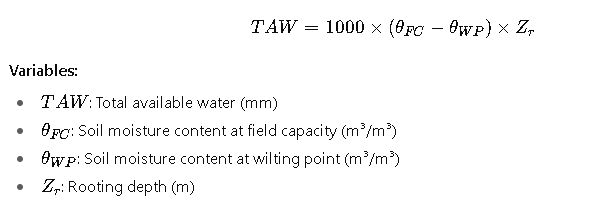
7. Total Available Water (TAW)
Extensive Tables of Common Values
Table 1. Crop Coefficients (Kc) by Growth Stage (FAO56 Standard)
| Crop | Initial Kc | Mid-season Kc | Late-season Kc | Rooting Depth (m) |
|---|---|---|---|---|
| Wheat | 0.70 | 1.15 | 0.25–0.40 | 1.0–1.5 |
| Maize (Corn) | 0.70 | 1.20 | 0.35–0.60 | 1.0–1.5 |
| Rice (Paddy) | 1.05 | 1.20 | 0.90 | 0.5–1.0 |
| Potato | 0.50 | 1.15 | 0.75 | 0.3–0.6 |
| Tomato | 0.60 | 1.15 | 0.70–0.90 | 0.5–1.0 |
| Alfalfa | 0.40 | 1.05–1.20 | 0.90–1.00 | 1.0–2.0 |
| Citrus (Orange) | 0.70 | 0.95–1.05 | 0.90 | 1.0–1.5 |
| Grapevine | 0.30–0.50 | 0.70–0.85 | 0.60–0.75 | 0.8–1.2 |
Table 2. Typical Irrigation Efficiencies (Ef)
| Irrigation Method | Efficiency Range (%) |
|---|---|
| Surface (Flood/Furrow) | 50–70 |
| Sprinkler (Center Pivot) | 70–85 |
| Sprinkler (Solid Set) | 60–75 |
| Drip (Surface) | 80–90 |
| Drip (Subsurface) | 85–95 |
Table 3. Soil Moisture Parameters
| Soil Type | Field Capacity (θFC) | Wilting Point (θWP) | Available Water (TAW per meter, mm) |
|---|---|---|---|
| Sand | 0.10–0.15 | 0.03–0.07 | 70–100 |
| Loamy Sand | 0.13–0.20 | 0.05–0.10 | 90–120 |
| Sandy Loam | 0.15–0.25 | 0.07–0.12 | 100–140 |
| Loam | 0.20–0.30 | 0.08–0.15 | 130–180 |
| Clay Loam | 0.25–0.35 | 0.10–0.18 | 150–200 |
| Clay | 0.30–0.40 | 0.15–0.20 | 160–220 |
Table 4. Common Values of Fraction p (Readily Available Water Fraction)
| Crop Type | ppp Value |
|---|---|
| Cereals | 0.50–0.55 |
| Vegetables | 0.30–0.40 |
| Forage Crops | 0.45–0.55 |
| Fruit Trees | 0.45–0.65 |
| Citrus | 0.50–0.65 |
| Vineyards | 0.40–0.55 |
Why These Parameters Matter
- Crop coefficients (Kc) link climatic demand with crop-specific behavior.
- Soil parameters (FC, WP, TAW, RAW) determine how long crops can sustain without irrigation.
- System efficiency corrects theoretical needs into practical field requirements.
- Irrigation interval ensures timely water delivery, reducing stress and yield loss.
These variables are interconnected, forming the backbone of precise irrigation scheduling models.