Accurately estimating crop yield or productivity is essential for agronomy, agricultural engineering, and food security planning. Yield estimation guides farm management, input optimization, logistics, and global supply forecasting with reliable professional analysis.
Crop Yield & Productivity Estimator
Estimate total yield from area, plant counts or sample measurements — supports hectares/acres, kg/ha, tonnes, and moisture adjustment.
Which method should I use?
Formulas used
By plants: kg/ha = (plants_per_ha × avg_weight_per_plant_g) / 1000 → total = kg/ha × area_ha.
By sample: kg/ha = (sample_weight_kg / sample_area_m2) × 10000 → total = kg/ha × area_ha.
Moisture (simple dry eq.): dry_yield = raw_yield × (100 – moisture%) / 100.
Units & conversions
Importance of Crop Yield Estimation
- Economic decision-making: Farmers and agribusinesses rely on accurate estimates to forecast revenue, negotiate contracts, and plan storage.
- Input optimization: Fertilizer, irrigation, and pest control programs can be adjusted based on expected yields.
- Food security: National agencies and organizations like the FAO (Food and Agriculture Organization of the United Nations) use yield estimates to model supply and prevent shortages (FAO, 2024).
- Environmental sustainability: Proper estimation prevents overuse of resources and helps track the impact of climate change on agricultural productivity.
Common Variables in Yield Estimation
The following are the most relevant variables in standard yield formulas. Each variable’s definition, typical range, and units are provided.
| Variable | Definition | Typical Range / Units | Notes |
|---|---|---|---|
| Plant population density (PPD) | Number of plants per unit area | 10,000–150,000 plants/ha | Depends on crop type (e.g., maize vs. wheat). |
| Ear/Pod/Tiller number (EPN) | Average number of ears, pods, or tillers per plant | 1–3 | Highly variable with management and genetics. |
| Grains per ear/pod (GPE) | Number of grains per ear or pod | 20–600 | Cereal crops have wide ranges; legumes usually <50. |
| Thousand Grain Weight (TGW) | Mass of 1000 grains | 10–500 g | Wheat: 35–50 g; rice: 20–30 g; maize: 250–350 g. |
| Biological Yield (BY) | Total above-ground biomass produced | 5–25 t/ha | Measured at harvest stage. |
| Harvest Index (HI) | Ratio of economic yield to biological yield | 0.25–0.55 | C3 crops: 0.25–0.45; C4 crops: up to 0.55. |
| Moisture Content (MC) | Grain moisture at harvest | 10–30% | Corrected to standard (e.g., 14% for maize). |
| Area harvested (A) | Land area under measurement | ha, m², or acres | Base denominator for yield expression. |
Core Formulas for Crop Yield Estimation
1. Basic Yield Formula (Mass per Area)
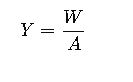
- Y = Yield (kg/ha or t/ha)
- W = Weight of harvested grain (kg)
- A = Area harvested (ha)
Used in direct harvest measurements (weighing plots).
2. Yield per Plant Approach
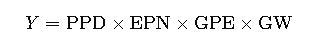
- PPD = Plant population density (plants/ha)
- EPN = Ears/pods/tillers per plant (number)
- GPE = Grains per ear/pod/tiller
- GW = Grain weight (g)
Provides theoretical maximum yield if all components perform optimally.
3. Yield with Thousand Grain Weight
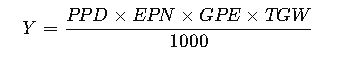
- TGW = Thousand grain weight (g)
- Denominator ensures unit consistency (g → kg).
4. Harvest Index Method
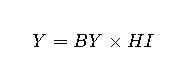
- BY = Biological yield (t/ha)
- HI = Harvest index (dimensionless ratio)
Widely used in crop physiology and breeding studies.
5. Moisture Content Adjustment
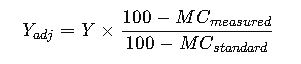
- Yadj = Moisture-adjusted yield (kg/ha or t/ha)
- MCmeasured = Measured moisture content (%)
- MCstandard = Standardized moisture (e.g., 14% maize, 12% wheat).
Ensures comparability across regions and storage safety.
Extended Reference Table: Common Yield Components by Crop
| Crop | PPD (plants/ha) | EPN | GPE | TGW (g) | HI | Typical Yield (t/ha) |
|---|---|---|---|---|---|---|
| Maize | 50,000–75,000 | 1 | 400–600 | 250–350 | 0.45–0.55 | 5–12 |
| Wheat | 150,000–300,000 | 2–3 tillers | 20–50 | 35–50 | 0.35–0.45 | 3–8 |
| Rice | 100,000–200,000 | 2–4 tillers | 80–150 | 20–30 | 0.40–0.50 | 4–10 |
| Soybean | 250,000–400,000 | 1–2 pods/branch | 2–3 seeds/pod | 100–200 | 0.35–0.45 | 2–5 |
| Barley | 200,000–350,000 | 2–3 tillers | 20–40 | 35–50 | 0.35–0.45 | 3–7 |
| Sorghum | 100,000–180,000 | 1–2 panicles | 1000–2000 grains | 25–40 | 0.40–0.50 | 2–6 |
| Potato | 40,000–50,000 | — | — | Tuber weight 100–200 g | HI 0.65–0.75 | 20–45 |
These values represent global averages. Local performance depends on climate, soil fertility, irrigation, and management practices.
Example 1: Maize Yield Estimation Using Component Method
Given data (field trial in Iowa, USA):
- PPD = 70,000 plants/ha
- EPN = 1 ear/plant
- GPE = 550 grains/ear
- TGW = 300 g
Calculation:
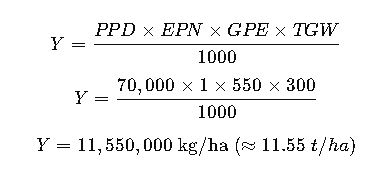
Interpretation:
This yield is consistent with high-yield irrigated maize systems in the U.S. Corn Belt. If biological yield was 25 t/ha, then HI = 11.55 ÷ 25 ≈ 0.46, which aligns with expected physiological efficiency.
Example 2: Rice Yield Estimation with Moisture Correction
Rice is one of the most globally important staple foods, feeding more than half of the world’s population. In rice-growing systems, yield estimates must be corrected for grain moisture content because harvested grain is often measured at higher moisture levels than the standard.
Imagine a farmer in Vietnam harvesting paddy rice from a one-hectare field. The raw weight of harvested paddy is 7,200 kg/ha, but the grain moisture content at harvest is 20%. The industry standard for reporting rice yield is 14% moisture. When adjusted, the corrected yield falls closer to 6,500 kg/ha.
This difference is critical because storage facilities, millers, and exporters require standardized values. Reporting unadjusted values could misrepresent the actual economic yield, lead to contract disputes, or result in incorrect national production statistics. Moisture correction is therefore a fundamental step in rice yield estimation, particularly in tropical and subtropical regions where drying efficiency can vary dramatically.
Integration of Remote Sensing in Yield Estimation
Modern agriculture increasingly relies on remote sensing technologies to estimate yield over large areas. While traditional methods are based on field sampling, remote sensing provides a scalable and often more cost-effective solution.
- Satellite Imagery
- Platforms like Sentinel-2 (ESA) and Landsat 8/9 (USGS/NASA) capture high-resolution multispectral imagery.
- Vegetation indices such as NDVI (Normalized Difference Vegetation Index) and EVI (Enhanced Vegetation Index) correlate strongly with biomass accumulation and potential yield.
- Drone-Based Imaging
- Unmanned Aerial Vehicles (UAVs) equipped with multispectral or hyperspectral sensors allow detailed monitoring at the field level.
- Farmers can detect spatial variability, nutrient stress, or waterlogging that directly influence yield.
- Machine Learning Models
- Combining remote sensing with machine learning enables prediction of yields with surprising accuracy.
- Algorithms ingest climate data, soil parameters, and spectral reflectance patterns to deliver predictive yield maps.
These technologies reduce dependency on manual sampling, provide near real-time updates, and are invaluable for regional or national scale yield forecasting.
For reference: NASA Harvest provides open-access projects on crop monitoring and yield forecasting worldwide.
Sources of Error in Crop Yield Estimation
Even with advanced tools, yield estimation is subject to error. Understanding these error sources is key to improving accuracy:
- Sampling Bias: Small plots may not represent whole-field variability. Selecting random, representative plots reduces this error.
- Moisture Measurement Errors: Inaccurate grain moisture meters or inconsistent drying protocols distort final yield numbers.
- Non-uniform Plant Density: Gaps in plant stand due to poor germination or pest damage cause deviations in estimates.
- Biological Factors: Lodging (plants falling over), pest outbreaks, or unseasonal rain can reduce harvestable yield compared to theoretical values.
- Remote Sensing Limitations: Cloud cover, image resolution, and sensor calibration affect satellite-derived estimates.
Best Practices for Reliable Yield Estimation
To minimize errors and improve precision, agronomists and farm managers can adopt the following practices:
- Use replicated sampling from multiple random locations within the field.
- Standardize all yield data to a uniform moisture basis.
- Apply GPS-based field mapping to capture spatial variability.
- Combine ground-truthing (physical measurements) with remote sensing to calibrate prediction models.
- Rely on validated statistical models for large-scale yield forecasts.
- Incorporate historical weather data to contextualize yield potential under varying climatic conditions.
Real-World Case Study: Wheat Yield Forecasting in India
India is the second-largest producer of wheat globally. Estimating wheat yield accurately is essential for food policy, procurement, and international trade.
In Punjab, India’s wheat belt, agricultural agencies combine field sampling with satellite-based vegetation indices. For instance:
- Ground-level sampling: Agronomists collect data from 1 m² plots, measuring spike number per plant and grain weight.
- Remote sensing validation: Sentinel-2 satellite data is analyzed for canopy density and chlorophyll content.
- Integration with weather models: Rainfall and temperature during key growth stages (booting and grain filling) are used to refine predictions.
The combination of these methods allows yield forecasts up to 4–6 weeks before harvest with an accuracy margin of ±5%. This level of precision enables government agencies to plan buffer stocks, regulate exports, and support farmers with fair pricing schemes.