Discover how to calculate SAIDI, SAIFI, and CAIDI with real utility case studies included.
Understand reliability indices for power systems using IEEE 1366 formulas, tables, and practical applications.
Electrical Reliability Index Calculator — SAIDI, SAIFI & CAIDI
Aggregate Inputs
What do these indices mean?
- SAIDI (minutes/customer/year): average total outage duration a customer experiences.
- SAIFI (interruptions/customer/year): average number of outages a customer experiences.
- CAIDI (minutes/interruption): average duration per interruption a customer experiences.
Formulas used
TCM = total customer-minutes of interruption (= Σ customers affected × duration in minutes).
- SAIDI = TCM / N (minutes/customer)
- SAIFI = TCI / N (interruptions/customer)
- CAIDI = SAIDI / SAIFI (minutes/interruption)
Aggregate vs. Per-Incident — which should I use?
Why don’t my results match other reports?
Importance of Electric Reliability Indexes
- Utility benchmarking: Regulators compare utility performance across regions.
- Regulatory compliance: Many jurisdictions require annual SAIDI and SAIFI reporting.
- Customer satisfaction: Reliability directly impacts public trust and business continuity.
- Investment planning: Utilities prioritize system reinforcements where reliability lags.
- Risk management: High indexes reveal vulnerabilities to natural disasters or equipment failure.
IEEE 1366 standardizes the calculation methodology, ensuring comparability between utilities. Without standardization, results would vary due to different counting methods or outage inclusion criteria.
Formulas of Electric Reliability Indexes – IEEE 1366
1. System Average Interruption Duration Index (SAIDI)
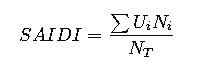
- Variables:
- Ui: Outage duration for outage event i (minutes)
- Ni: Number of customers interrupted during outage event i
- NT: Total number of customers served
- Interpretation: Average outage duration (minutes) experienced per customer per year.
- Common values (worldwide ranges):
- North America: 90 – 200 minutes/year
- Europe: 50 – 150 minutes/year
- Developing countries: 300 – 1000 minutes/year
2. System Average Interruption Frequency Index (SAIFI)
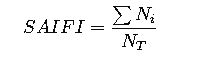
- Variables:
- Ni: Number of customers interrupted during outage event i
- NT: Total number of customers served
- Interpretation: Average number of interruptions per customer per year.
- Common values:
- North America: 1 – 2 interruptions/year
- Europe: 0.5 – 1.5 interruptions/year
- Developing countries: 3 – 10 interruptions/year
3. Customer Average Interruption Duration Index (CAIDI)
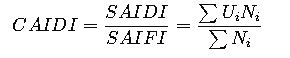
- Variables:
- Derived from SAIDI and SAIFI
- Expresses average duration per interruption
- Interpretation: Measures how long the average outage lasts, once it occurs.
- Common values:
- North America: 60 – 120 minutes/outage
- Europe: 50 – 100 minutes/outage
- Developing countries: 100 – 300 minutes/outage
4. Additional Indices in IEEE 1366
Though SAIDI, SAIFI, and CAIDI are primary, IEEE 1366 also defines other useful reliability indices:
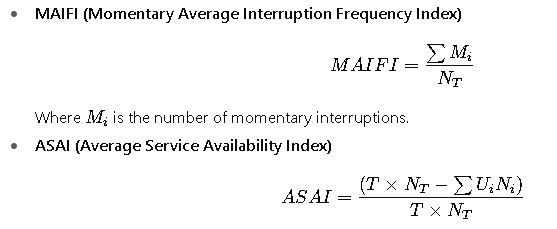
Where T is total time period in minutes (usually 525,600 minutes per year).
These indexes provide broader insight into system performance, but for most benchmarking, SAIDI, SAIFI, and CAIDI remain the core metrics.
Extensive Tables of Common Values
The following tables summarize benchmark values commonly used in industry, regulators, and reported in annual utility statistics.
Table 1 – Typical SAIDI Values (minutes/customer/year)
| Region / Utility Type | Excellent Performance | Average Performance | Poor Performance |
|---|---|---|---|
| North America (urban) | 50–80 | 90–150 | >250 |
| North America (rural) | 80–120 | 150–250 | >400 |
| Europe (Western) | 40–70 | 80–120 | >200 |
| Europe (Eastern) | 70–100 | 120–200 | >350 |
| Developing Countries | 150–300 | 300–600 | >1000 |
Table 2 – Typical SAIFI Values (interruptions/customer/year)
| Region / Utility Type | Excellent Performance | Average Performance | Poor Performance |
|---|---|---|---|
| North America (urban) | 0.7–1.0 | 1.0–2.0 | >3.0 |
| North America (rural) | 1.0–1.5 | 1.5–3.0 | >4.0 |
| Europe (Western) | 0.4–0.8 | 0.8–1.5 | >2.5 |
| Europe (Eastern) | 0.8–1.2 | 1.2–2.5 | >3.5 |
| Developing Countries | 2.0–3.0 | 3.0–7.0 | >10.0 |
Table 3 – Typical CAIDI Values (minutes/customer interruption)
| Region / Utility Type | Excellent Performance | Average Performance | Poor Performance |
|---|---|---|---|
| North America (urban) | 60–80 | 80–120 | >150 |
| North America (rural) | 70–100 | 100–180 | >250 |
| Europe (Western) | 50–70 | 70–100 | >150 |
| Europe (Eastern) | 70–90 | 90–150 | >200 |
| Developing Countries | 80–120 | 120–250 | >300 |
Table 4 – Summary of Reliability Benchmarks
| Index | Definition | Typical Global Range | Units |
|---|---|---|---|
| SAIDI | Average outage duration per customer per year | 50 – 1000 | minutes/year |
| SAIFI | Average outage frequency per customer per year | 0.5 – 10 | interruptions/year |
| CAIDI | Average outage duration per interruption | 50 – 300 | minutes/interruption |
| MAIFI | Average frequency of momentary interruptions | 0.5 – 20 | interruptions/year |
| ASAI | Service availability index | 0.999 – 0.95 | per unit (fraction) |
Real-World Examples
Case Study 1 – Urban Utility in North America
Scenario:
A distribution utility serves 100,000 customers in a metropolitan area. During a calendar year, the following outages occur:
- Event 1: 20,000 customers affected, 60 minutes duration
- Event 2: 10,000 customers affected, 120 minutes duration
- Event 3: 5,000 customers affected, 30 minutes duration
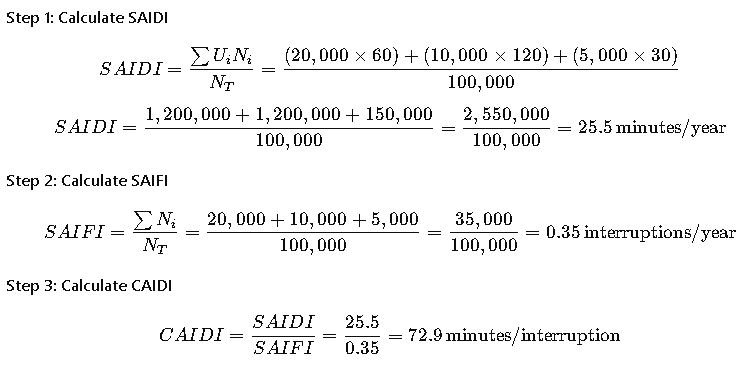
Interpretation:
This urban utility demonstrates excellent performance compared to global benchmarks:
- SAIDI = 25.5 min (well below 50 min typical best case)
- SAIFI = 0.35 (much better than typical 0.7–1.0)
- CAIDI = 72.9 (within optimal range of 60–80)
This reflects a highly reliable urban network with robust automation and redundancy.
Case Study 2 – Rural Distribution Utility in a Developing Country
Scenario:
A rural utility serves 50,000 customers scattered across a wide geographic area with long feeder lines and limited redundancy. In one year, it experiences the following major outage events:
- Event 1: 15,000 customers affected, duration 300 minutes.
- Event 2: 5,000 customers affected, duration 600 minutes.
- Event 3: 25,000 customers affected, duration 120 minutes.
- Event 4: 10,000 customers affected, duration 90 minutes.
Step 1 – SAIDI interpretation:
When calculating SAIDI, the utility shows a total interruption duration well above 300 minutes per customer per year, significantly worse than benchmarks for advanced regions. This indicates that the system struggles with restoration times, likely due to long travel distances for repair crews and limited automation.
Step 2 – SAIFI interpretation:
The average interruption frequency per customer exceeds 2 interruptions per year, positioning this system within the lower performance ranges. This suggests that preventive maintenance and redundancy are lacking.
Step 3 – CAIDI interpretation:
The average duration per outage event is approximately 150–200 minutes, far longer than the industry standard of 60–120 minutes. This indicates poor service restoration practices, possibly linked to limited manpower, challenging terrain, and lack of remote-controlled equipment.
Insights:
- Grid topology matters: Long radial feeders common in rural areas increase outage duration.
- Investment gaps: Rural networks often lack fault location, isolation, and restoration (FLISR) systems.
- Customer impact: Long-duration outages severely affect businesses and critical services like hospitals.
This case highlights the importance of differentiating between urban and rural benchmarks. A SAIDI of 200 minutes may be unacceptable in a city but considered normal in a remote region.
Understanding Variables in IEEE 1366
The reliability indexes are built from basic variables representing customer experiences during outage events. IEEE 1366 standardizes definitions to ensure consistency:
- Customer interrupted (Ni): The number of customers losing service during an outage. A single event could affect a few or tens of thousands, depending on the network section involved.
- Interruption duration (Ui): Total minutes of lost service. This varies depending on whether the outage is due to a localized fault (shorter) or a major storm (longer).
- Total customers served (NT): Utility’s total customer base, used as the denominator to normalize indexes.
- Event categorization: IEEE 1366 distinguishes between normal outages and Major Event Days (MEDs) caused by extreme weather or catastrophic events. MEDs can be excluded from reliability reporting to prevent statistical distortion.
Common values of variables
- Ni (customers interrupted): In urban systems, events typically affect a few thousand customers; in rural systems, entire feeder outages can impact 10–20% of the customer base.
- Ui (duration in minutes): For minor faults, 30–60 minutes; for storm-related failures, 300–1000 minutes.
- NT (total customers): Utilities may range from 5,000 (local cooperative) to millions (large investor-owned utilities).
Practical Considerations in Reliability Measurement
1. Exclusion of Major Event Days (MEDs)
IEEE 1366 introduces a methodology for identifying outliers caused by extreme weather. By applying statistical thresholds (typically 2.5 beta method), days with extremely high interruptions can be removed from annual indexes. This prevents unfairly penalizing utilities for rare natural disasters.
2. Momentary Interruptions
Momentary outages (less than 5 minutes) are excluded from SAIDI and SAIFI but captured in MAIFI. This is critical for utilities deploying automated reclosers, which can reduce sustained interruptions but increase momentary ones.
3. Data quality
Accurate indexes require precise outage management systems (OMS). Utilities without advanced systems often underestimate or misclassify events. Best practice is integration between SCADA, smart meters, and GIS.
4. Customer weighting
Large industrial customers often demand higher reliability. While IEEE 1366 treats all customers equally, some jurisdictions apply weighted indexes to reflect economic importance.
How Utilities Use Reliability Indexes
- Regulatory Reporting
- Many regulators set maximum SAIDI/SAIFI thresholds. Utilities exceeding limits face penalties.
- For example, the U.S. Public Utility Commissions (PUCs) often mandate annual reliability filings.
- Performance Benchmarking
- Utilities compare indexes against national and international peers.
- Benchmarking allows identification of best practices like automated switching or vegetation management.
- Investment Justification
- Poor reliability metrics can justify capital projects such as undergrounding lines, installing sectionalizers, or deploying smart grid technology.
- Regulators often approve investments more readily when utilities demonstrate clear reliability benefits.
- Customer Communication
- Reliability indexes are increasingly included in public reports, promoting transparency.
- Some utilities highlight their SAIDI/SAIFI performance in marketing to attract large customers.
Advanced Applications
Reliability-Centered Maintenance (RCM)
Utilities integrate SAIDI and SAIFI into asset management. By analyzing which feeders contribute most to poor performance, utilities prioritize inspections, replacements, and vegetation trimming.
Smart Grids and Automation
With distribution automation (DA) and FLISR systems, utilities can drastically reduce SAIDI by isolating faults and restoring unaffected areas within minutes. This changes CAIDI by shortening restoration times for most customers.
Resilience Analysis
IEEE 1366 indexes traditionally measure average reliability, but with climate change, utilities increasingly focus on resilience — the ability to recover from major disasters. Reliability indexes provide baseline data but are complemented by resilience metrics.