Instant voltage drop limits calculator: NEC and IEC compliant, auto-applies 3%/5% rules for lighting, feeders.
Enter nominal voltage and optional measured drop; get pass/fail, max allowable volts, length helper instantly.
Maximum Allowable Voltage Drop Calculator (US NEC & EU IEC/BS)
Which limits are used by standards?
Europe (IEC/BS): common design practice is ≤3% for lighting and ≤5% for other circuits. Grid supply variation (EN 50160) is typically ±10% at customer terminals (informative).
Formulas used
Notes & good practice
Maximum Allowable Voltage Drop Values According to Standards
The following tables compile common voltage drop limits and guidelines from major global standards. These values reflect typical recommendations for various voltage levels and applications, including residential, commercial, and industrial environments.
Table 1: Maximum Allowable Voltage Drop by Standard and Application
| Standard | Application | Voltage Level | Recommended Max % Drop | Notes |
|---|---|---|---|---|
| NEC 210.19(A)(1) Informational Note | Branch Circuits (Residential) | ≤ 600V | 3% | 3% total for branch; 5% total for feeder + branch |
| NEC 215.2(A)(4) Informational Note | Feeder Circuits | ≤ 600V | 3% | Applies to feeders; combine with branch drop for total 5% |
| IEC 60364-5-52 | Low-voltage installation | ≤ 1000V | 4% | 6% allowed for special equipment like motors or heating |
| IEEE Std 141 (Red Book) | Power Distribution | Medium voltage | ≤ 5% | Lower preferred (1-2%) in sensitive industrial environments |
| AS/NZS 3000:2018 | General Electrical Installations | ≤ 1000V | 5% | Higher for motor starting acceptable temporarily |
| CEC (Canada) | General Use | ≤ 600V | 5% | 3% feeders, 2% branches (suggested) |
Table 2: Typical Voltage Drop Limits by Application Type
| Application Type | Voltage Drop Limit (%) | Typical Cable Length | Conductor Material | Frequency |
|---|---|---|---|---|
| Residential Lighting | 3 | <30 m | Copper | 50/60 Hz |
| Industrial Motor Loads | 5 | >100 m | Copper or Aluminum | 50/60 Hz |
| Commercial HVAC | 4 | 50–100 m | Copper | 50/60 Hz |
| Data Centers | 2 | <50 m | Copper | 60 Hz |
| Agricultural Systems | 5 | >200 m | Aluminum | 60 Hz |
Key Formulas for Maximum Allowable Voltage Drop
To perform an accurate voltage drop calculation, engineers must understand several core formulas based on Ohm’s Law and power equations.
1. General Voltage Drop Formula (Single-Phase AC)
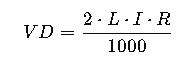
- VD = Voltage Drop (Volts)
- L = One-way conductor length (meters)
- I = Load current (Amperes)
- R = Conductor resistance (Ohms per kilometer)
Common values:
- R for Copper: ~0.0175 Ω·mm²/m
- R for Aluminum: ~0.0282 Ω·mm²/m
2. Voltage Drop (Three-Phase AC)
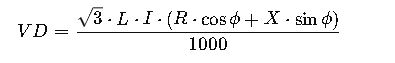
- X = Conductor reactance (Ohms/km)
- cosφ / sinφ = Power factor (PF), usually 0.8–0.95 for inductive loads
3. Voltage Drop as Percentage
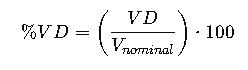
- V_nominal = System nominal voltage (Volts)
4. Alternative Simplified Formula for Copper Conductors
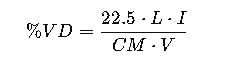
- CM = Circular mils of conductor
- V = Voltage (Volts)
Conductor Resistivity Table (Common for Calculations)
| Material | Resistivity (Ω·mm²/m) | Temp Coefficient (α) | Typical Use Cases |
|---|---|---|---|
| Copper | 0.0175 | 0.00393 /°C | Residential, data, industrial |
| Aluminum | 0.0282 | 0.00403 /°C | Utility, overhead lines |
Real-World Application Examples
Example 1: Residential Feeder to Subpanel (NEC Standard)
Scenario: A 120/240V single-phase residential feeder powers a subpanel located 30 meters away. The load is 50A. The conductor is copper, with a size of 6 AWG.
Known Values:
- L = 30 m
- I = 50 A
- R (6 AWG copper) ≈ 0.00328 Ω/m
- V_nominal = 240V
Voltage Drop:
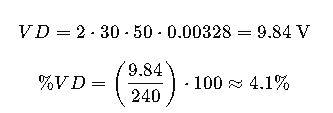
Evaluation: Exceeds NEC recommended 3% for feeders. A larger conductor (4 AWG) is needed.
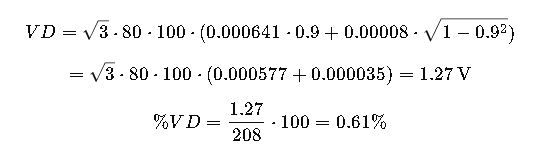
Example 2: Industrial Three-Phase Motor Feeder (IEC 60364)
Scenario: A 400V three-phase 50Hz motor rated at 75A is located 120 meters from the main switchboard. Aluminum conductors are used. Power factor is 0.85. Use 3 conductors of 35 mm².
Known Values:
- L = 120 m
- I = 75 A
- cosφ = 0.85
- R (35 mm² Al) = 0.868 Ω/km = 0.000868 Ω/m
- X (estimated) = 0.08 Ω/km = 0.00008 Ω/m
Voltage Drop:
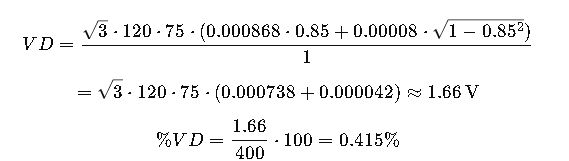
Evaluation: Voltage drop is well below the IEC 60364 limit (4%). Conductor sizing is acceptable.
Voltage Drop Considerations Beyond Formulas
- Temperature Correction: Resistance increases with conductor temperature. Apply NEC/IEC temperature correction factors when applicable.
- Conductor Material: Aluminum conductors require larger sizes to achieve the same voltage drop as copper.
- Bundling & Raceway Effects: Derating may apply, which can affect current and voltage drop.
- Future Expansion: Design with ~10–20% margin for load growth or longer lengths.
- Harmonics & Distortion: Non-linear loads can increase effective impedance, leading to greater voltage drops.
Standard References and External Resources
- NFPA 70: National Electrical Code (NEC)
- IEC 60364 Series – Electrical Installations for Buildings
- IEEE Std 141 – Electric Power Distribution for Industrial Plants
- AS/NZS 3000:2018 – Australian/New Zealand Wiring Rules
- Canadian Electrical Code (CEC)
Extended Voltage Drop Tables for Copper and Aluminum Conductors
This section provides practical voltage drop values across various distances and amperages. These tables assume:
- Single-phase AC systems
- 230V nominal voltage
- Power factor = 1 (for simplicity)
- Conductor resistance from standard NEC Table 8
Table 3: Voltage Drop in Volts – Copper, Single-Phase, 230V
| Conductor Size (AWG/mm²) | Resistance (Ω/km) | Distance (m) | 10 A | 20 A | 30 A | 40 A | 50 A |
|---|---|---|---|---|---|---|---|
| 14 AWG / 2.08 mm² | 8.928 | 15 | 2.68 | 5.36 | 8.03 | 10.71 | 13.39 |
| 12 AWG / 3.31 mm² | 5.62 | 30 | 3.37 | 6.74 | 10.12 | 13.49 | 16.86 |
| 10 AWG / 5.26 mm² | 3.52 | 45 | 3.17 | 6.35 | 9.52 | 12.70 | 15.87 |
| 8 AWG / 8.37 mm² | 2.21 | 60 | 2.65 | 5.30 | 7.96 | 10.61 | 13.27 |
| 6 AWG / 13.3 mm² | 1.39 | 75 | 2.09 | 4.18 | 6.27 | 8.36 | 10.45 |
| 4 AWG / 21.2 mm² | 0.87 | 90 | 1.57 | 3.13 | 4.70 | 6.27 | 7.83 |
Table 4: Voltage Drop in Volts – Aluminum, Single-Phase, 230V
| Conductor Size (AWG/mm²) | Resistance (Ω/km) | Distance (m) | 10 A | 20 A | 30 A | 40 A | 50 A |
|---|---|---|---|---|---|---|---|
| 6 AWG / 13.3 mm² | 2.16 | 30 | 1.30 | 2.60 | 3.89 | 5.19 | 6.49 |
| 4 AWG / 21.2 mm² | 1.36 | 45 | 1.22 | 2.45 | 3.67 | 4.89 | 6.12 |
| 2 AWG / 33.6 mm² | 0.86 | 60 | 1.03 | 2.06 | 3.09 | 4.12 | 5.15 |
| 1/0 AWG / 53.5 mm² | 0.54 | 75 | 0.81 | 1.62 | 2.43 | 3.24 | 4.05 |
| 3/0 AWG / 85 mm² | 0.34 | 90 | 0.66 | 1.32 | 1.98 | 2.64 | 3.30 |
How to use: Divide the resulting voltage drop by 230V and multiply by 100 to get the percentage drop.
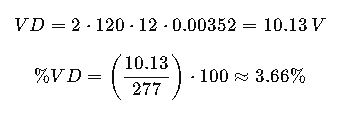
Real-World Example 3: Underground Cable Installation
Scenario: A school installs an underground lighting system using a 277V single-phase circuit. The distance from the panel to the farthest light is 120 meters. Total load: 12 A. Using copper 10 AWG.
Step-by-Step Calculation:
- L = 120 m