This technical guide explains live to carcass weight ratio calculators and essential performance parameters accurately.
Engineers, nutritionists, processors use this calculator for benchmarking, yield optimization, and compliance verification in operations.Live-to-Carcass Weight Ratio and Dressing Percentage Calculator
Overview and Purpose
This document describes the design, formulas, measurement procedures, and practical use of Live to Carcass Weight Ratio calculators (also called dressing percentage or carcass yield calculators). It targets engineers, meat scientists, processors, and software developers responsible for implementing accurate, auditable yield computations.
Key definitions and terminology
- Live weight (LW): Animal weight prior to slaughter, measured on farm or at lairage.
- Carcass weight (CW): Weight of the carcass after slaughter and standard processing (head on/off, evisceration, hide removal).
- Dressing percentage (DP) / Carcass yield (CY): Ratio indicating how much of live weight becomes carcass, usually expressed as a percentage.
- Hot carcass weight (HCW): Carcass weight measured immediately post-slaughter (before cooling).
- Chilled carcass weight (CCW): Carcass weight after defined chilling period (typically 24–48 hours), accounting for evaporative shrink.
- Boneless trimmed weight (BTW): Final saleable meat weight after boning and trimming; used for value chain calculations.
Primary formula and variable explanation
Core formula used in calculators:
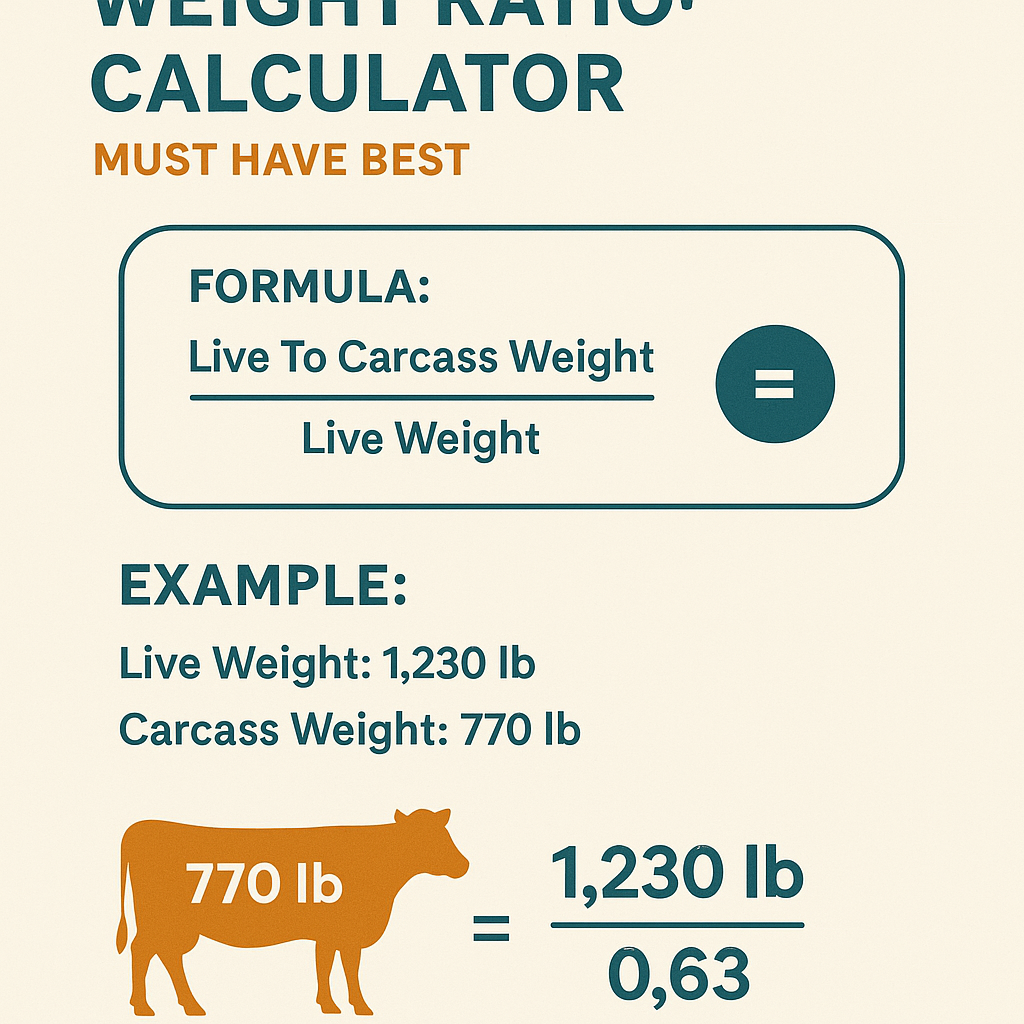
Variable explanation and typical values
- Live weight (LW): Measured in kilograms (kg) or pounds (lb). Typical values:
- Cattle: 350–700 kg (heifers/steers vary by market).
- Pigs (market hogs): 100–140 kg.
- Lambs: 30–70 kg.
- Carcass weight (CW): Measured after standard slaughter processing, in same units.
- Cattle hot carcass weight: 180–450 kg.
- Pig carcass weight: 60–100 kg.
- Lamb carcass weight: 15–40 kg.
- Yield (%) range:
- Cattle: typically 50–65% depending on hide removal, head-on/off, gut fill.
- Pigs: typically 65–75% for standard slaughter procedures.
- Lamb: typically 40–55% depending on removal protocols.
Expanded formulas and derivations
When building a calculator you will often need derived metrics. Common derivations shown using plain HTML:
1) Dressing percentage (DP):
2) Boneless yield from carcass:
3) Final saleable yield from live:
4) Chilling shrink adjustment (if calculating from HCW to CCW):
Shrink fraction typical = 0.01 to 0.03 (1%–3%) for beef; 0.5%–2% for pork depending on protocols.
Variable definitions with typical numeric examples
- HCW = Hot carcass weight (e.g., 320 kg for a beef steer).
- Shrink fraction = portion lost in chilling (example 0.02 = 2%).
- CCW = 320 × (1 − 0.02) = 313.6 kg.
- Boneless trimmed weight example: BTW = 200 kg; Boneless yield (%) = (200 ÷ 313.6) × 100 ≈ 63.8% (of carcass).
Measurement protocols and data quality
Accurate calculator outputs depend on rigorous measurement protocols and metadata. Consider the following requirements for valid results:
- Timestamped measurements: record date/time of LW and CW measurements.
- Measurement conditions: note whether CW is hot or chilled and whether head/hide/offal included.
- Scale calibration certificates: keep traceable calibration records per regulatory requirements.
- Ambient conditions: temperature and humidity may affect chilling shrink; include as optional inputs.
- Record of practices: e.g., whether the hide was removed pre- or post-weighing, whether trimming protocols apply.
Calculator design considerations (software architecture)
When implementing a Live to Carcass Weight Ratio Calculator ensure the following functional and non-functional requirements:
- Input validation: enforce units (kg/lb), require mandatory fields (LW, CW), provide unit conversion routines.
- Audit trail: store original inputs, user IDs, timestamps, and calculation version for traceability.
- Configurability: allow users to define shrink fractions, trimming factors, and measurement protocol flags.
- Batch mode: support bulk CSV/XLS imports for hundreds or thousands of animals with vectorized computations.
- Reporting: output DP, HCW/CCW conversions, boneless yield estimates, and summary statistics (means, SD, percentiles).
- Precision: use appropriate numeric precision (e.g., double with rounding rules consistent with regulatory reporting).
Statistical quality control and validation
To ensure reliability, include QC and validation steps in the implementation:
- Outlier detection: flag LW or CW values outside species-specific plausible ranges or outside ±3 standard deviations of batch mean.
- Cross-checks: if animal ID has historical LW, compare to expected growth curves to detect input errors.
- Uncertainty propagation: if LW and CW have measurement uncertainties, compute uncertainty in DP using standard propagation formulas.
Uncertainty propagation (simple linearized approach)
When LW and CW have measurement uncertainties (σ_LW and σ_CW), approximate standard uncertainty of DP (%) using linearization:
Let DP = 100 × (CW / LW).
Partial derivatives:
∂DP/∂CW = 100 ÷ LW
∂DP/∂LW = −100 × CW ÷ (LW × LW)
Combined standard uncertainty (σ_DP):
σ_DP ≈ sqrt( (∂DP/∂CW × σ_CW)^2 + (∂DP/∂LW × σ_LW)^2 )
Example typical measurement uncertainties:
σ_LW = 0.5 kg (calibrated floor scale)
σ_CW = 0.3 kg (carcass hanging scale)
Common adjustments and conversion factors
Practical calculators must manage several adjustments:
- Head-off vs head-on: removing head reduces carcass weight by species-dependent mass (approx. cattle head 25–40 kg).
- Hide weight: for cattle hide can represent 10–12% of live weight; hide removal changes DP calculation if hide was included in LW or CW.
- Gut fill: pre-slaughter gut fill can add several kilograms to LW; lairage fasting reduces variability.
- Fat trimming and bone-in vs boneless: conversions used to estimate saleable product from carcass weights.
Extensive tables with common values
Below are tables of representative LW, CW and DP values for common commercial classes. These are realistic typical ranges used for benchmarking and calibration.
| Species/Class | Typical Live Weight (kg) | Typical Carcass Weight (kg) | Typical DP (%) | Notes |
|---|---|---|---|---|
| Beef - Young steer | 350 | 210 | 60.0 | Head-off, hide removed, HCW |
| Beef - Mature steer | 500 | 300 | 60.0 | HCW, industry average |
| Beef - Heifer | 420 | 252 | 60.0 | Leaner class may be slightly lower DP |
| Pig - Market hog | 110 | 77 | 70.0 | Standard commercial dressing, head-off |
| Pig - Heavy hog | 130 | 88 | 67.7 | Fat content influences DP |
| Lamb - Market | 45 | 22.5 | 50.0 | Typical carcass yield |
| Lamb - Heavy | 65 | 34 | 52.3 | Higher DP for mature lambs |
| Goat - Market | 35 | 16.8 | 48.0 | Smaller carcass yields vs lamb |
| Veal calf | 180 | 98 | 54.4 | Young animal, leaner composition |
| Species | Live Weight Range (kg) | Carcass Weight Range (kg) | DP Range (%) | Chill Shrink Typical (%) |
|---|---|---|---|---|
| Beef | 300–700 | 150–450 | 50–65 | 1–3 |
| Pork | 80–160 | 55–110 | 65–75 | 0.5–2 |
| Sheep/Lamb | 20–80 | 10–45 | 40–55 | 0.5–2 |
| Goat | 20–60 | 9–30 | 40–52 | 0.5–1.5 |
Examples with full development and solutions
Example 1 — Commercial pig batch (single animal)
Problem: Calculate dressing percentage and expected boneless trimmed yield for a market hog where:
- Live weight (LW) measured at lairage = 115.0 kg
- Hot carcass weight (HCW) measured immediately post-slaughter = 80.3 kg
- Chilling shrink assumed = 1.2% (0.012) for CCW calculation
- Boneless trimmed weight (BTW) after deboning estimated = 58.0 kg
Step 1: Compute dressing percentage from HCW
Step 2: Compute chilled carcass weight (CCW)
Step 3: Compute dressing percentage using CCW (optional)
Step 4: Compute boneless yield as percent of CCW and of LW
Boneless yield relative to CCW (%) = (BTW ÷ CCW) × 100 = (58.0 ÷ 79.285) × 100 = 73.17%
Saleable yield relative to LW (%) = (BTW ÷ LW) × 100 = (58.0 ÷ 115.0) × 100 = 50.43%
Final results summary:
- Dressing percentage (HCW basis) = 69.83%
- Chilled carcass weight = 79.285 kg
- Dressing percentage (CCW basis) = 68.9%
- Boneless trimmed yield = 73.17% of CCW; 50.43% of LW
Example 2 — Beef steer with head-off and trimming
Problem: For a beef steer, calculate DP and saleable yield. Inputs:
- Live weight (LW) = 480 kg (measured pre-slaughter after 24 h lairage fast)
- Hot carcass weight (HCW) = 288 kg (head-off, hide removed)
- Chill shrink = 2.0% (0.02)
- Estimated boneless trimmed weight (BTW) after primary cuts = 170 kg
- Additional trimming losses during fabrication = 3.0% of CW
Step 1: Compute DP on HCW basis
Step 2: Compute CCW after chilling
Step 3: Account for trimming losses (3.0% of CW), compute final BTW validated
Trimming loss mass = CW × 0.03 = 288 × 0.03 = 8.64 kg (this is often deducted from CW before boning)
Adjusted carcass available = CCW − trimming losses (applied to CW mass) → approximate available for boning = 282.24 − 8.64 = 273.6 kg
Final results summary:
- Dressing percentage (HCW) = 60.00%
- Chilled carcass weight = 282.24 kg
- Saleable boneless yield = 35.42% of LW
- Boneless yield = 62.16% of adjusted carcass mass
Example 3 — Batch aggregation and statistics (brief)
Problem: Compute batch mean DP and coefficient of variation for five lambs with LW and CW measured.
Data (LW kg / CW kg): (40/20), (42/22), (38/19), (45/24), (44/23)
Compute DP for each:
- 1: (20÷40)×100 = 50.00%
- 2: (22÷42)×100 = 52.38%
- 3: (19÷38)×100 = 50.00%
- 4: (24÷45)×100 = 53.33%
- 5: (23÷44)×100 = 52.27%
Mean DP ≈ (50 + 52.38 + 50 + 53.33 + 52.27) ÷ 5 = 51.596%.
Standard deviation (sample) ≈ compute per standard formula ≈ 1.57% (approximate value).
Coefficient of variation = (SD ÷ mean) × 100 ≈ (1.57 ÷ 51.596) × 100 ≈ 3.04%.
Batch metrics allow monitoring of process stability and detection of anomalies.
Reporting, auditability and regulatory compliance
Regulatory regimes often require documented measurement procedures for carcass weights and grading. Recommended references and authoritative resources include:
- Food and Agriculture Organization (FAO) — livestock statistics and measurement guidance: http://www.fao.org/
- Codex Alimentarius (FAO/WHO) — food quality and labelling standards: https://www.fao.org/fao-who-codexalimentarius/en/
- United States Department of Agriculture (USDA) — grading and standards information: https://www.ams.usda.gov/
- European Food Safety Authority (EFSA) — scientific assessments and risk communication: https://www.efsa.europa.eu/
- World Organisation for Animal Health (OIE) — animal health standards affecting trade and measurement practices: https://www.oie.int/
For auditability include:
- Measurement device identifiers and calibration dates.
- Operator ID and signatures for manual measurements.
- Versioning of calculator algorithms documented and timestamped.
Best practices for applying calculators in commercial settings
- Standardize measurement protocol across sites: same scales, same timing, identical handling rules.
- Prefer chilled carcass weights for commercial settlements where shrink has stabilized.
- Include metadata flags indicating “head-on/head-off”, “hide on/off”, and chilling status.
- Implement batch-level QC with automatic alerts for out-of-range DP values.
- Use historical benchmarking per genetic line and feed regime to set realistic expected DP bands.
- Apply correction factors only when supported by empirical plant-level measurements and recorded evidence.
UX and integration recommendations for calculator interfaces
- Clear unit selector (kg/lb) with conversion preview.
- Input helper texts explaining HCW vs CCW and indicating default shrink values.
- Bulk upload with preview and validation row-by-row.
- Exportable reports in CSV and PDF with header metadata for traceability.
- APIs for integration with slaughterhouse MES or ERP systems with secure authentication and audit logs.
Validation, testing and acceptance criteria
Before production deployment, perform these verification steps:
- Unit tests for formula correctness across edge cases (zero, negative, extremely large inputs).
- Integration tests for CSV imports and API endpoints.
- Comparison tests vs manual calculations on a 100+ sample dataset to confirm numerical parity.
- Performance tests where batch sizes exceed expected operational loads (e.g., thousands of records per minute in large plants).
- User acceptance tests with operators to confirm workflow usability.
Normative references and standards
Relevant standards and guidance documents that influence measurement protocols, traceability, and reporting:
- FAO — Guidance on livestock production statistics and reporting: http://www.fao.org/livestock-systems/
- Codex Alimentarius (FAO/WHO) — General standards for food hygiene and country-specific measurement guidelines: https://www.fao.org/fao-who-codexalimentarius/en/
- USDA Agricultural Marketing Service — Carcass grading and specification documents: https://www.ams.usda.gov/grades-standards
- EU Commission — Food safety and official controls (general requirements affecting measurement and labelling): https://ec.europa.eu/food/safety_en
- International Organization for Standardization — relevant quality management and measurement standards (e.g., ISO/IEC 17025 laboratory calibration, ISO 9001 quality management): https://www.iso.org/home.html
Limitations and caveats
- Biological variability: DP varies by breed, sex, age, and physiological status; calculators provide estimates within defined confidence intervals.
- Measurement protocol divergence: inconsistent definitions (e.g., whether live weight includes stuck gut fill or water) will bias comparisons.
- Regulatory differences: legal definitions of carcass classes and allowable deductions differ by jurisdiction; local adaptation required.
- Shrink, trim and fabrication conventions must be harmonized for commercial settlements.
Appendix — Additional tables for conversion and benchmarking
| Species | Parameter | Typical Value | Unit | Use |
|---|---|---|---|---|
| Beef | Hide weight fraction | 0.10–0.12 | Fraction of LW | Remove if hide included in LW |
| Beef | Head weight | 25–40 | kg | Adjust head-on/head-off differences |
| Pork | Chill shrink | 0.005–0.02 | Fraction | HCW→CCW adjustment |
| Sheep | Fleece weight | 0.5–5.0 | kg | Remove if fleece included unexpectedly |
| General | Scale precision | ±0.5 | kg | Typical floor scale calibration |
Final operational checklist (quick reference)
- Confirm units and convert to base unit (kg recommended for international use).
- Record LW with operator ID and scale calibration details.
- Record CW and indicate HCW/CCW status, head/hide status, and trimming rules.
- Apply shrink and trimming factors only if protocol documented and evidence exists.
- Compute DP and additional derived metrics; store audit trail.
- Aggregate batch statistics and run QC algorithms before final reporting.
Further reading and authority links
- FAO — Animal Production and Health Division: http://www.fao.org/animal-production/en/
- Codex Alimentarius — General Principles and standards: https://www.fao.org/fao-who-codexalimentarius
- USDA AMS — Grades and Standards for meat products: https://www.ams.usda.gov/grades-standards
- EFSA — Scientific outputs relevant to meat safety and composition: https://www.efsa.europa.eu/
- OIE — Standards for animal health affecting international trade: https://www.oie.int/
Implementations of Live to Carcass Weight Ratio Calculators must combine robust measurement protocols, rigorous auditability, and configurable conversion factors to support commercial settlements, process optimization, and regulatory compliance. Proper validation and ongoing QC ensure outputs are reliable for decision-making across the value chain.