The Optical Density at 600 nm (OD₆₀₀) measures cell concentration indirectly in microbiology and biotechnology.
It uses spectrophotometry at 600 nm, where cellular light scattering relates to total biomass concentration.
Optical Density (OD₆₀₀) → Cells/mL Calculator
Core Principles of OD₆₀₀ Measurement
The principle relies on Beer–Lambert Law, which states that the absorbance of a sample is proportional to the concentration of the absorbing species and the path length of the cuvette.
General form of Beer–Lambert Law:
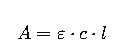
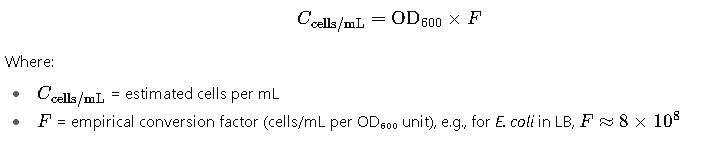
Where:
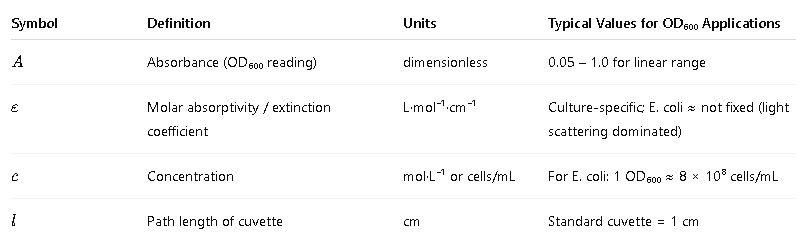
Important: In microbial suspensions, OD₆₀₀ is dominated by light scattering, not true absorbance, so extinction coefficients are empirical.
Common OD₆₀₀ Conversion Values Table
The relationship between OD₆₀₀ and cell concentration varies between species, strains, and growth conditions. Below is an extensive reference table for Escherichia coli in LB medium at 37°C, using a 1 cm cuvette, based on widely cited values from.
| OD₆₀₀ | Approx. Cells/mL (×10⁸) | Approx. Dry Weight (g/L) | Notes |
|---|---|---|---|
| 0.05 | 0.4 | 0.002 | Early lag phase |
| 0.10 | 0.8 | 0.004 | Lag/early log phase |
| 0.20 | 1.6 | 0.008 | Early exponential |
| 0.30 | 2.4 | 0.012 | Mid-exponential |
| 0.40 | 3.2 | 0.016 | Mid-exponential |
| 0.50 | 4.0 | 0.020 | Late exponential |
| 0.60 | 4.8 | 0.024 | Late exponential |
| 0.70 | 5.6 | 0.028 | Late exponential |
| 0.80 | 6.4 | 0.032 | Early stationary |
| 0.90 | 7.2 | 0.036 | Early stationary |
| 1.00 | 8.0 | 0.040 | Saturated linear range |
| 1.50 | 12.0 | 0.060 | Non-linear scattering begins |
| 2.00 | 16.0 | 0.080 | Dilution recommended |
| 3.00 | 24.0 | 0.120 | Well beyond linear range |
| 4.00 | 32.0 | 0.160 | Requires heavy dilution |
Interpretation: Most spectrophotometers have a linear range up to OD₆₀₀ ≈ 0.8–1.0. Beyond that, dilution is necessary.
Essential OD₆₀₀ Calculator Formulas
1. Converting OD₆₀₀ to Cell Concentration
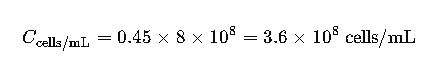
Example:
If OD₆₀₀ = 0.45:
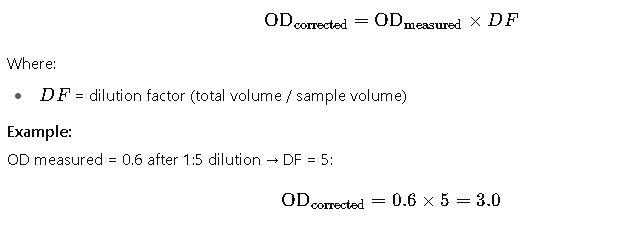
2. Correcting for Dilution
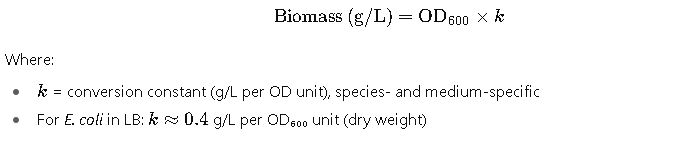
3. Converting OD₆₀₀ to Biomass (Dry Weight)
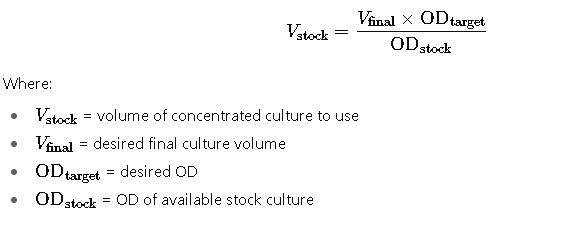
4. Estimating Culture Volume for Target OD
Frequently Asked Questions (FAQ) about Optical Density (OD₆₀₀) Calculator
1. What is OD₆₀₀ used for?
OD₆₀₀ is used to estimate the concentration of cells in a culture by measuring how much light at 600 nm is scattered or absorbed.
2. Why measure at 600 nm?
This wavelength minimizes interference from most growth media components and provides optimal sensitivity for bacterial cell suspensions.
3. Can OD₆₀₀ measure live and dead cells?
Yes. OD₆₀₀ measures total biomass, so both live and dead cells contribute to the reading.
4. Is OD₆₀₀ the same for all microorganisms?
No. Each species and even strain has a unique correlation between OD₆₀₀ and actual cell concentration.
5. What is the typical linear range for OD₆₀₀?
Most spectrophotometers have a reliable range between 0.05 and 0.8. Higher readings require sample dilution.
6. How often should I calibrate OD₆₀₀ to cell counts?
Calibration should be performed whenever you change organism, strain, medium, or measurement equipment.
7. Can I use microplates instead of cuvettes?
Yes, but you must correct for the shorter path length and ensure your instrument supports this format.
8. What’s the difference between absorbance and turbidity?
Absorbance refers to light absorbed by molecules; turbidity (as in OD₆₀₀) is dominated by light scattering from particles like cells.
9. Why does OD₆₀₀ sometimes give inconsistent results?
Variations can occur due to differences in path length, instrument calibration, bubble presence, or uneven sample mixing.
10. Can OD₆₀₀ be used for growth rate calculation?
Yes. By measuring OD₆₀₀ at regular intervals, you can generate growth curves and calculate doubling times.