Optical Density at 600 nm (OD600) is widely used in microbiology and biotechnology for estimating microbial cell density. Accurate OD600 measurement ensures reproducibility, supports scale-up processes, and provides reliable insights into microbial physiology and growth kinetics.
OD600 → Cells / mL & Pathlength-corrected OD Calculator
Convert measured OD600 into estimated cells per mL, correct for pathlength (microplate vs cuvette), and explore common organism presets. Designed for lab use — include your calibration factor for best results.
How is OD600 corrected for pathlength?
What conversion factor should I use?
Formula used by this calculator
OD_corr = OD_meas × (1 cm / pathlength_cm).2) Cells per mL (uncorrected dilution):
cells/mL = OD_corr × conversion_factor × dilution_factor.Note: dilution_factor is what you multiplied the original sample by (e.g., 10 if you diluted 1:10).
Why OD600 Measurement Matters
- Bioprocess Control: OD600 correlates with cell biomass and is used to control fermentation and scale-up operations.
- Standardization: Ensures comparable data across labs and instruments.
- Non-Destructive: Quick, inexpensive, and non-invasive compared to direct cell counting or gravimetric methods.
- Predictive Tool: Used to estimate growth rate, doubling time, and biomass concentration.
OD600 is not a direct measure of cell number, but rather an indirect estimation based on light scattering. The reliability of this correlation depends on multiple factors: wavelength, path length, microbial species, and instrument calibration.
Extensive Reference Table of Common OD600 Values
Below is a reference table showing approximate correlations between OD600 readings and colony-forming units (CFU/mL) or dry cell weight (DCW, g/L) for Escherichia coli and other common microorganisms. These values vary between instruments, but the ranges provide a practical starting point.
Table 1. Common OD600 Reference Values for Microbial Cultures
| OD600 Reading | Approx. Cell Concentration (E. coli) (CFU/mL) | Approx. Dry Cell Weight (g/L) | Notes |
|---|---|---|---|
| 0.05 | ~2 × 10⁶ | 0.02 | Near detection limit, very dilute culture |
| 0.1 | ~8 × 10⁶ | 0.04 | Typical inoculation density |
| 0.2 | ~1.6 × 10⁷ | 0.08 | Early exponential phase |
| 0.3 | ~2.4 × 10⁷ | 0.12 | Standard for growth curve initiation |
| 0.5 | ~4 × 10⁷ | 0.20 | Mid-exponential growth |
| 0.8 | ~6.4 × 10⁷ | 0.32 | Common reference point for induction |
| 1.0 | ~8 × 10⁷ | 0.40 | Upper exponential phase |
| 2.0 | ~1.6 × 10⁸ | 0.80 | Late exponential phase |
| 3.0 | ~2.4 × 10⁸ | 1.20 | Transition to stationary phase |
| 4.0 | ~3.2 × 10⁸ | 1.60 | Dense culture, significant light scattering |
| 6.0 | ~4.8 × 10⁸ | 2.40 | High-density, approaching stationary phase |
| 8.0 | ~6.4 × 10⁸ | 3.20 | Requires dilution for accurate measurement |
| 10.0 | ~8 × 10⁸ | 4.00 | Beyond linear range, unreliable without correction |
Important Note: Each spectrophotometer has a linear range (typically OD600 0.1 – 0.8). Beyond this, dilutions are required to maintain accuracy.
Core Formulas for Optical Density Calculation (OD600)
Optical density is a measure of how much a sample absorbs or scatters light. The calculation is rooted in the Beer–Lambert Law, but adapted for microbial suspensions where scattering dominates.
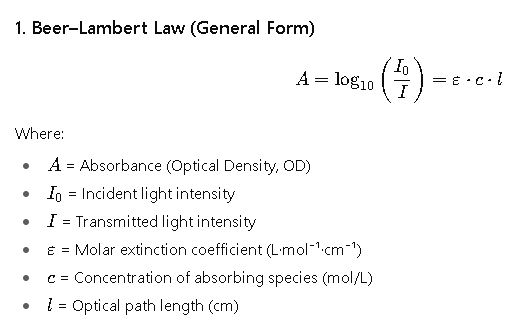
In microbial suspensions, OD600 is measured as AAA, but instead of pure absorption, scattering dominates.
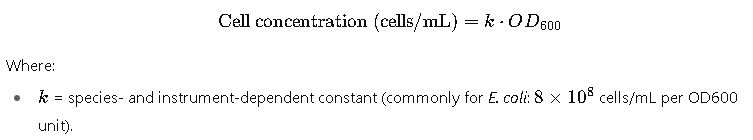
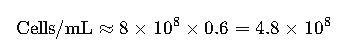
2. Conversion Between OD600 and Cell Density
Example:
If OD600 = 0.6, then
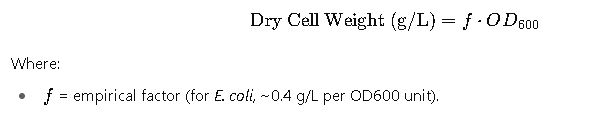
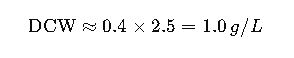
3. Conversion Between OD600 and Dry Cell Weight
Another widely used relation:
Example:
If OD600 = 2.5, then
4. Dilution Correction Formula
When OD600 exceeds the linear range:
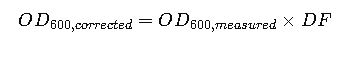
Where:
- DF= dilution factor
- Example: If OD600 measured = 0.9 at 1:10 dilution, then corrected OD600 = 0.9 × 10 = 9.0
5. Specific Growth Rate from OD600
For growth kinetics:
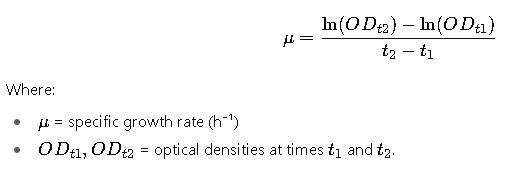
This is essential in bioprocess optimization and microbial physiology.
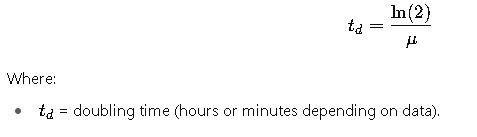
6. Doubling Time
Derived from growth rate:
Variables in OD600 Equations: Detailed Explanation
Instrumental Variables
- Wavelength (λ): Standardized at 600 nm because it minimizes interference from culture media components.
- Path Length (l): Usually 1 cm in standard cuvettes; in microplate readers, path length correction is necessary.
- Blank (I₀): Always subtract media background for accurate OD values.
Biological Variables
- Cell Morphology: Rods vs. cocci scatter differently.
- Species Calibration: Each species has a unique correlation factor kkk.
- Growth Phase: OD600-to-biomass correlation may shift due to changes in cell size and refractive index.
Experimental Variables
- Dilution: Required for high-density cultures.
- Shaking Prior to Measurement: Prevents settling of cells.
- Temperature and Bubbles: Both can artificially affect readings.
Common Reference Values for OD600-to-Biomass Conversions
Table 2. OD600 Conversion Factors for Different Microorganisms
| Species | Conversion Factor (Cells/mL per OD600) | Conversion Factor (g DCW/L per OD600) | Notes |
|---|---|---|---|
| E. coli | ~8 × 10⁸ | 0.4 | Most common reference |
| Saccharomyces cerevisiae (yeast) | ~1.5 × 10⁷ | 0.25 | Larger cells, lower scatter |
| Bacillus subtilis | ~7 × 10⁸ | 0.35 | Gram-positive rod |
| Pseudomonas aeruginosa | ~1 × 10⁹ | 0.42 | High scatter due to size |
| Lactobacillus spp. | ~5 × 10⁸ | 0.30 | Variability between strains |
| Corynebacterium glutamicum | ~9 × 10⁸ | 0.38 | Used in industrial fermentation |
These conversion factors must be calibrated per laboratory using standard curves (CFU vs. OD600 or DCW vs. OD600).
Practical Applications of OD600 in Research and Industry
Optical Density at 600 nm is not limited to academic laboratories. It is an indispensable tool in biotechnology, pharmaceuticals, environmental sciences, and industrial fermentation. Understanding its applications in detail allows scientists and engineers to make data-driven decisions.
1. Monitoring Bacterial Growth in Research
OD600 is the most common method for tracking bacterial growth curves. Instead of labor-intensive cell counting, researchers use OD600 to determine lag phase, exponential growth, and stationary phase dynamics. This provides critical information for gene expression studies, antibiotic testing, and metabolic profiling.
2. Scale-Up of Bioprocesses
Industrial fermentation relies on OD600 monitoring during pilot-scale experiments. By establishing correlations between OD600 and biomass, engineers ensure consistency when moving from a 250 mL flask to a 2000 L bioreactor. Growth control allows optimized nutrient feeding and prevents overflow metabolism.
3. Pharmaceutical and Biopharmaceutical Applications
In vaccine production, OD600 is used to standardize bacterial cultures before inactivation or protein extraction. In recombinant protein expression systems (for example, E. coli producing insulin or enzymes), OD600 values guide the timing of induction with IPTG or other inducers.
4. Environmental and Ecological Studies
OD600 is widely used to assess microbial activity in wastewater treatment, soil samples, and environmental monitoring. Tracking OD600 over time provides an indirect estimate of microbial load and helps evaluate the effectiveness of bioremediation strategies.
5. Education and Teaching Labs
Universities and colleges teach OD600 measurement as a fundamental laboratory technique. Students learn how optical density correlates with microbial population dynamics, ensuring familiarity with essential tools for microbiology and biotechnology.
Case Study 1: Recombinant Protein Expression in E. coli
A biotechnology laboratory is expressing a recombinant enzyme in E. coli. The induction of protein expression depends on bacterial culture density. Researchers must ensure that induction occurs during the exponential growth phase, typically at an OD600 of 0.6 to 0.8.
- Procedure:
- The team inoculates a flask of LB broth with a starter culture.
- OD600 is measured every 30 minutes.
- At OD600 = 0.65, IPTG is added to trigger expression.
- Growth continues until OD600 = 2.0 before harvesting cells.
- Outcome:
- Induction at the correct OD600 ensures optimal enzyme yield.
- A second trial induced at OD600 = 1.2 showed significantly lower protein expression, confirming the importance of accurate timing.
- Key Takeaway:
OD600 is not just a number — it directly influences gene expression success. Accurate measurement leads to higher yield and reproducibility.
Case Study 2: Industrial Fermentation for Bioethanol Production
An industrial plant is optimizing yeast (Saccharomyces cerevisiae) fermentation for bioethanol production. Monitoring biomass concentration is essential for maximizing ethanol yield while preventing nutrient depletion.
- Procedure:
- Initial yeast inoculation is standardized at OD600 = 0.2.
- Continuous OD600 monitoring ensures growth remains within the exponential phase.
- At OD600 = 3.5, nutrient feeding is adjusted to maintain high metabolic activity.
- Once OD600 reaches 6.0, cells enter stationary phase, and ethanol production slows.
- Outcome:
- By adjusting feeding rates based on OD600 readings, ethanol yield increased by 18%.
- Batch consistency improved across production cycles.
- Key Takeaway:
In large-scale production, OD600 is not only a laboratory measurement but also a tool for process optimization and economic efficiency.
Limitations of OD600 Measurement
Although widely used, OD600 is not without challenges. Understanding its limitations prevents data misinterpretation.
- Non-Linear at High Density: Beyond OD600 of ~0.8, values deviate from linear correlation with biomass. Dilution is necessary.
- Species-Specific Differences: Yeast, bacteria, and filamentous fungi scatter light differently, requiring species-specific calibration.
- Cell Morphology and Size Changes: During stationary phase or stress, cell shape changes, altering scattering behavior.
- Instrument Variability: Different spectrophotometers produce slightly different OD600 values, requiring in-lab calibration.
- Media Interference: Colored or turbid media contribute to absorbance, leading to overestimation of cell density.
Best Practices for Reliable OD600 Measurement
To minimize variability and increase reproducibility, follow these best practices:
- Always Blank the Instrument: Use sterile growth medium without cells to zero the spectrophotometer.
- Stay Within Linear Range: Dilute samples when OD600 exceeds 0.8.
- Mix Samples Before Reading: Prevent sedimentation and uneven distribution of cells.
- Use Standard Cuvette Path Length: If using microplates, apply path-length correction.
- Perform Species-Specific Calibration: Establish a correlation curve between OD600 and actual biomass.
- Avoid Bubbles and Fingerprints: Both introduce measurement errors.
- Record Temperature and Instrument Settings: Ensure data reproducibility across experiments.