Understanding Km and Vmax is crucial in enzymology, pharmacokinetics, and bioprocess engineering for kinetic modeling.
These constants define enzymatic efficiency and substrate affinity in Michaelis-Menten rate equations and kinetic experiments.
Km and Vmax Calculator (Michaelis-Menten)
Common Values for Km and Vmax in Biochemical Systems
The values of Km and Vmax vary across enzymes, substrates, and conditions (temperature, pH, ionic strength). Below is a detailed table summarizing commonly reported values from literature and experimental datasets.
Common Km Values for Selected Enzymes
| Enzyme | Substrate | Km (μM) | Source Organism | Reference |
|---|---|---|---|---|
| Hexokinase | Glucose | 50 – 100 | Homo sapiens | Berg et al., 2002 |
| Lactate dehydrogenase (LDH) | Pyruvate | 20 – 80 | Rabbit muscle | Lehninger Principles of Biochemistry |
| Acetylcholinesterase | Acetylcholine | 10 – 100 | Electrophorus electricus | PubChem: 5948 |
| Alcohol dehydrogenase | Ethanol | 1000 – 5000 | Saccharomyces cerevisiae | Enzyme Handbook, Springer |
| DNA polymerase I | dNTPs | 1 – 10 | Escherichia coli | Nature Reviews Molecular Cell Biology |
Common Vmax Values for Selected Enzymes
| Enzyme | Substrate | Vmax (μmol/min/mg protein) | Conditions |
|---|---|---|---|
| Hexokinase | Glucose | 200 – 300 | pH 7.4, 37 °C |
| Lactate dehydrogenase (LDH) | Pyruvate | 600 – 1000 | 25 °C, NADH excess |
| Acetylcholinesterase | Acetylcholine | 1500 – 2500 | Room temp, pH 8.0 |
| Alcohol dehydrogenase | Ethanol | 400 – 700 | 37 °C, saturating NAD⁺ |
| DNA polymerase I | dNTPs | 300 – 500 | 37 °C, pH 7.0 |
These ranges are helpful for approximating enzyme behavior, designing kinetic assays, and validating experimental outputs.
Michaelis-Menten Equation and All Required Formulas
The core model for enzyme kinetics is the Michaelis-Menten equation, derived from steady-state assumptions. The general equation is:
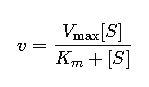
Where:
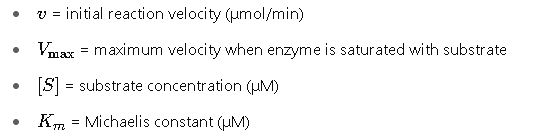
Explanation of Variables
- S (Substrate concentration): The concentration of substrate available at a given point in time. It influences how close the enzyme operates to Vmax.
- Vmax (Maximum velocity): The theoretical maximum rate achieved when all enzyme active sites are saturated with substrate. It’s influenced by enzyme concentration.Km (Michaelis constant): The substrate concentration at which the reaction rate is half of Vmax. It reflects the enzyme’s affinity for the substrate; a lower Km indicates higher affinity.
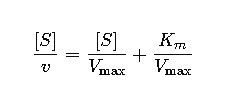
Linearized Forms for Km and Vmax Calculation
1. Lineweaver-Burk Plot (Double Reciprocal Plot)
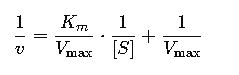
This linear equation is in the form y=mx+b where:
- Slope = Km/Vmax
- y-intercept = 1/Vmax
- x-intercept = −1/Km
This plot is commonly used in labs to estimate Km and Vmax by plotting 1/v vs 1/[S].
2. Eadie-Hofstee Plot
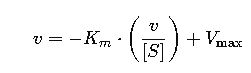
Less prone to error propagation from double reciprocals. Here:
- Slope = −Km
- y-intercept = Vmax
3. Hanes-Woolf Plot
This rearrangement reduces error by minimizing the inverse of small values.
Real-World Examples of Km and Vmax Calculation
Example 1: Determining Km and Vmax for Lactate Dehydrogenase
Context: A biochemical lab measures reaction rates of LDH at varying pyruvate concentrations.
| [S] (μM) | v (μmol/min) |
|---|---|
| 10 | 50 |
| 20 | 85 |
| 50 | 150 |
| 100 | 180 |
| 200 | 195 |
Step 1: Create Lineweaver-Burk values
| [S] (μM) | v (μmol/min) | 1/[S] (μM⁻¹) | 1/v (min/μmol) |
|---|---|---|---|
| 10 | 50 | 0.1 | 0.020 |
| 20 | 85 | 0.05 | 0.0118 |
| 50 | 150 | 0.02 | 0.0067 |
| 100 | 180 | 0.01 | 0.0056 |
| 200 | 195 | 0.005 | 0.0051 |
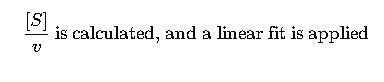
Step 2: Plotting and Linear Regression
Using least-squares fit:
- Slope (Km/Vmax) ≈ 0.14
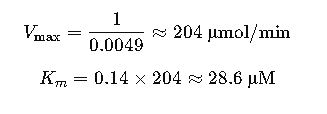
- y-intercept (1/Vmax) ≈ 0.0049
Step 3: Solve for Km and Vmax
Example 2: Determining Enzyme Affinity in Drug Development
Context: A pharmaceutical company is testing a new compound metabolized by cytochrome P450 enzymes.
| [S] (μM) | v (μmol/min) |
|---|---|
| 5 | 20 |
| 10 | 36 |
| 20 | 60 |
| 50 | 83 |
| 100 | 92 |
Following the same approach with a Hanes-Woolf plot:
- Slope = 0.01
- y-intercept = 0.3
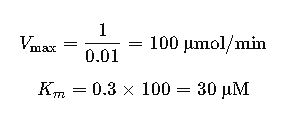
This data suggests the enzyme has a moderate affinity (Km = 30 μM) and reaches a plateau near 100 μmol/min.
Experimental Strategies for Accurate Km and Vmax Determination
Reliable determination of Km and Vmax requires rigorous experimental control. Errors in pipetting, temperature, or data fitting can lead to significant deviation.
Key Experimental Guidelines
- Maintain enzyme in initial rate conditions:
Ensure measurements are made before substrate depletion or product inhibition occurs. - Use at least 6–8 different substrate concentrations:
- Distribute them both below and above the expected Km value.
- Example: if expected Km is 20 μM, test concentrations like 1, 5, 10, 20, 50, 100 μM.
- Perform each measurement in triplicate:
Reduces standard deviation and improves confidence. - Correct for background activity:
Include a blank (no enzyme) control to account for non-enzymatic degradation. - Buffer conditions:
Standardize pH, ionic strength, and temperature. Even small changes affect Km and Vmax. - Use saturating cofactor concentrations:
When needed (e.g., NAD⁺ for dehydrogenases), ensure cofactors aren’t limiting.
Inhibition Effects on Km and Vmax
Different types of enzyme inhibition alter the Km and Vmax values in unique ways, impacting how the data must be interpreted.
Summary Table: Effect of Inhibitors on Km and Vmax
| Inhibitor Type | Km | Vmax | Explanation |
|---|---|---|---|
| Competitive | ↑ (increases) | No change | Inhibitor competes with substrate; apparent Km increases |
| Non-competitive | No change | ↓ (decreases) | Binds to enzyme-substrate complex; reduces catalytic efficiency |
| Uncompetitive | ↓ (decreases) | ↓ (decreases) | Inhibitor binds only after ES complex is formed |
| Mixed | ↑ or ↓ | ↓ | Variable effects; depends on affinity for enzyme vs ES complex |
Modified Michaelis-Menten for Competitive Inhibition:
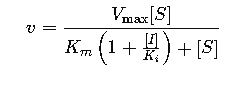
Where:
- [I]= inhibitor concentration
- Ki= inhibition constant
This equation allows fitting competitive inhibition data and estimating Ki, a crucial pharmacokinetic parameter.
Software Tools for Km and Vmax Regression
For accurate, reproducible, and visual analysis, many researchers rely on specialized software for nonlinear curve fitting.
Popular Software Tools
| Software | Features | License |
|---|---|---|
| GraphPad Prism | Nonlinear regression, Lineweaver-Burk, global fitting | Commercial |
| SigmaPlot | Custom equations, enzyme kinetics templates | Commercial |
| R (nls function) | Open-source nonlinear least squares, high customization | Free (Open source) |
| MATLAB | Powerful modeling, curve fitting toolbox | Commercial |
| PyEnzyme (Python) | Scientific enzyme modeling, reproducible scripts | Open source |
These tools accept raw [S],v pairs and apply models to estimate kinetic parameters, often with confidence intervals.
Use in Modern Applications
1. Drug Discovery & Enzyme Inhibition Screening
High-throughput screening of drug candidates against enzymes like COX-2, acetylcholinesterase, or HMG-CoA reductase includes:
- Measuring Km and Vmax with and without the inhibitor
- Estimating Ki and determining inhibition type
- Optimizing lead compounds for increased specificity
Example: A COX-2 selective NSAID might show:
- Without drug: Km = 12 μM, Vmax = 220 μmol/min
- With drug: Km = 45 μM, Vmax = 220 μmol/min → competitive inhibition
2. Industrial Enzyme Optimization
In bioreactors, understanding enzyme kinetics is essential for scaling up processes such as:
- Lactose hydrolysis in dairy with β-galactosidase
- Cellulose breakdown in biofuel production
- Penicillin conversion with penicillin amidase
Engineers adjust:
- Substrate load
- Temperature and pH
- Enzyme dosage
…to operate close to Vmax without exceeding substrate inhibition levels.
Frequently Asked Questions (FAQ)
What does a high Km value mean?
A high Km indicates low substrate affinity — more substrate is required to reach half of Vmax.
Can two enzymes have the same Km but different Vmax?
Yes. Km reflects binding affinity, while Vmax depends on enzyme concentration and catalytic turnover.
Is the Michaelis-Menten model always applicable?
No. It assumes:
- One substrate,
- No cooperativity,
- No product inhibition.
More complex models are needed for allosteric enzymes or multiple-substrate reactions.
How to choose between linear and nonlinear regression?
Nonlinear regression is preferred for accurate estimation. Linear forms (e.g., Lineweaver-Burk) are useful for visualization but may distort errors.
How do cofactors affect Km and Vmax?
If a cofactor is limiting, Vmax is reduced. Saturating cofactor levels ensure that Km reflects true substrate affinity.
Authoritative References and Further Reading
- Berg JM, Tymoczko JL, Stryer L. Biochemistry. 5th edition.
https://www.ncbi.nlm.nih.gov/books/NBK21154/ - Cornish-Bowden A. Fundamentals of Enzyme Kinetics. Wiley-Blackwell.
- GraphPad Prism Enzyme Kinetics Guide
https://www.graphpad.com/guides/prism/latest/curve-fitting/ - IUBMB Enzyme Nomenclature Database
https://www.qmul.ac.uk/sbcs/iubmb/enzyme/