Understanding rainfall conversion from millimeters to liters per square meter is crucial in hydrology, meteorology, and engineering. This method simplifies rainfall measurement, helping quantify precipitation effects on water resources, agriculture, infrastructure, and environmental management.
Precipitation Converter — mm → L/m²
Fast, accurate, and accessible rainfall conversions
Why 1 mm = 1 L/m²?
Use cases
Conversion Principle: Millimeters to Liters per Square Meter
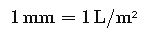
The relationship is remarkably straightforward:
- 1 millimeter (mm) of precipitation = 1 liter (L) of water per square meter (m²).
This equivalence arises because 1 mm of rain represents a water depth of 0.001 meters spread evenly over 1 m². The resulting volume is:
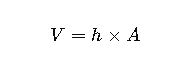
Where:
- V= Volume of precipitation (m³)
- h = Rainfall depth (m)
- A= Surface area (m²)
Since 1 m³ = 1000 L, the formula simplifies perfectly into the 1:1 relationship:
Extensive Conversion Table: Common Precipitation Values
The following table provides common rainfall depths in millimeters and their equivalent water accumulation in liters per square meter (L/m²). This table is especially valuable for practitioners who need quick reference values in hydrological studies, irrigation planning, or stormwater design.
| Rainfall Depth (mm) | Equivalent Water (L/m²) | Equivalent Volume on 100 m² Roof (L) | Equivalent Volume on 1 ha (10,000 m²) (L) |
|---|---|---|---|
| 0.5 mm | 0.5 L/m² | 50 L | 5,000 L |
| 1 mm | 1 L/m² | 100 L | 10,000 L |
| 2 mm | 2 L/m² | 200 L | 20,000 L |
| 5 mm | 5 L/m² | 500 L | 50,000 L |
| 10 mm | 10 L/m² | 1,000 L | 100,000 L |
| 15 mm | 15 L/m² | 1,500 L | 150,000 L |
| 20 mm | 20 L/m² | 2,000 L | 200,000 L |
| 25 mm | 25 L/m² | 2,500 L | 250,000 L |
| 30 mm | 30 L/m² | 3,000 L | 300,000 L |
| 40 mm | 40 L/m² | 4,000 L | 400,000 L |
| 50 mm | 50 L/m² | 5,000 L | 500,000 L |
| 75 mm | 75 L/m² | 7,500 L | 750,000 L |
| 100 mm | 100 L/m² | 10,000 L | 1,000,000 L |
| 150 mm | 150 L/m² | 15,000 L | 1,500,000 L |
| 200 mm | 200 L/m² | 20,000 L | 2,000,000 L |
| 250 mm | 250 L/m² | 25,000 L | 2,500,000 L |
| 300 mm | 300 L/m² | 30,000 L | 3,000,000 L |
| 400 mm | 400 L/m² | 40,000 L | 4,000,000 L |
| 500 mm | 500 L/m² | 50,000 L | 5,000,000 L |
This extensive table illustrates how even small rainfall events can accumulate significant water volumes over large catchment areas.
Detailed Formulas for Precipitation Conversion
While the base conversion is straightforward, multiple formulas apply depending on the application (surface area scaling, runoff estimation, or collection efficiency).
1. Basic Conversion Formula
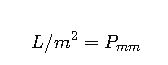
Where:
- Pmm= Precipitation depth in millimeters
Explanation: Each millimeter of precipitation corresponds to one liter of water per square meter.
2. Volume of Water Collected over a Surface
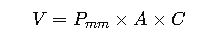
Where:
- V= Volume of water collected (L)
- Pmm = Precipitation depth (mm)
- A= Surface area (m²)
- C= Runoff coefficient (dimensionless, 0–1)
Typical runoff coefficients (C):
- Concrete/Asphalt: 0.85 – 0.95
- Roofs (metal/tile): 0.75 – 0.90
- Lawns: 0.10 – 0.30
- Agricultural land: 0.30 – 0.50
- Forest: 0.10 – 0.25
This formula accounts for real-world losses due to infiltration, evaporation, or surface storage.
3. Conversion for Large Catchment Areas
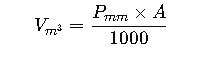
Where:
- Vm³= Volume of precipitation (m³)
- A= Area in square meters (m²)
The division by 1000 converts liters into cubic meters, as 1 m³ = 1000 L.
4. Annual Precipitation Volume
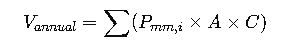
Where:
- Pmm,i= Rainfall event iii (mm)
- A= Area (m²)
- C= Runoff coefficient
This is crucial for rainwater harvesting design and urban stormwater planning.
5. Relation with Hydrological Balance
In water balance studies, precipitation is one input variable:
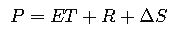
Where:
- P= Precipitation (mm or L/m²)
- ET= Evapotranspiration (mm)
- R= Runoff (mm)
- ΔS= Change in soil storage (mm)
This ensures precipitation volumes are properly allocated in hydrological cycle modeling.
Practical Applications of Precipitation Conversion
The conversion of precipitation from millimeters to liters per square meter is not just a theoretical tool—it plays a fundamental role in real-world engineering, environmental science, and resource management. Below are two detailed applications that illustrate its importance.
Case Study 1: Rainwater Harvesting for Domestic Supply
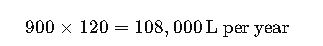
Imagine a household with a roof area of 120 m² located in a region with an average annual rainfall of 900 mm. The homeowners want to estimate how much water they can collect for non-potable uses such as irrigation, toilet flushing, and laundry.
1.Conversion of Rainfall
- 900 mm of annual precipitation = 900 L/m².
- Over a 120 m² roof:
2.Adjustment for Runoff Coefficient
Roof runoff efficiency typically ranges from 0.8–0.9 due to evaporation and minor losses. Using 0.85:

3.Result
This household can collect nearly 92,000 liters of water per year, equivalent to more than 240 liters per day—enough to offset significant portions of municipal water use.
Importance:
- In areas facing water scarcity, this calculation allows households and institutions to design storage tanks of adequate size.
- It also helps municipalities encourage sustainable water management.
Case Study 2: Flood Risk Assessment in Urban Catchments
Urban planners often assess flood risks by estimating runoff volumes after intense rainfall. Let’s consider a neighborhood with 20,000 m² of impervious surfaces (roads, parking lots, rooftops).
1.Rainfall Event
A storm delivers 50 mm of precipitation within 24 hours.
- Equivalent precipitation: 50 L/m².
2.Total Water Volume
That equals 1,000 cubic meters of water.
3.Runoff Coefficient
Urban impervious surfaces have coefficients around 0.9:

4.Result
Nearly 900,000 liters of water would flow into stormwater drains. If drainage capacity is insufficient, the excess will accumulate, causing localized flooding.
Importance:
- Such calculations are vital in designing stormwater infrastructure, retention basins, and flood control systems.
- Authorities can simulate different storm scenarios using mm-to-L/m² conversions to ensure safety and resilience.
Real-World Relevance Across Sectors
The mm-to-L/m² conversion is more than a mathematical curiosity. It influences decision-making across several domains:
- Agriculture
Farmers estimate soil water availability and irrigation requirements. For example, if a crop requires 500 mm during its growing season, that equals 500 L/m², helping schedule irrigation precisely. - Hydrology and Meteorology
Meteorologists report rainfall in mm, while hydrologists translate this into water volumes for watersheds and reservoirs. This is the basis for hydrological balance studies and flood modeling. - Urban Planning and Civil Engineering
Conversion helps design stormwater networks, green roofs, permeable pavements, and retention ponds to mitigate flood risks. - Environmental Management
Authorities use precipitation-to-volume conversions to assess groundwater recharge, streamflow variations, and ecological impacts. - Renewable Water Supply
NGOs and governments calculate rainwater harvesting potential to provide drinking water in rural or arid regions.
Extended Conversion Table for Roof Sizes
To provide even more practical insight, here is a table showing collected rainwater volume for different roof areas and rainfall depths.
| Rainfall (mm) | Roof Area 50 m² | Roof Area 100 m² | Roof Area 200 m² | Roof Area 500 m² |
|---|---|---|---|---|
| 5 mm | 250 L | 500 L | 1,000 L | 2,500 L |
| 10 mm | 500 L | 1,000 L | 2,000 L | 5,000 L |
| 20 mm | 1,000 L | 2,000 L | 4,000 L | 10,000 L |
| 50 mm | 2,500 L | 5,000 L | 10,000 L | 25,000 L |
| 100 mm | 5,000 L | 10,000 L | 20,000 L | 50,000 L |
| 200 mm | 10,000 L | 20,000 L | 40,000 L | 100,000 L |
This table is particularly relevant for rainwater harvesting system design. It allows quick estimation of water yield depending on roof size and rainfall intensity.
Why This Conversion Is Universally Used
The 1:1 equivalence of mm and L/m² is widely adopted because it:
- Simplifies communication between meteorologists, engineers, and the public.
- Provides intuitive understanding—people can visualize liters of water more easily than millimeters of rainfall.
- Supports scalability—the same principle applies whether analyzing a 10 m² roof or a 10,000 km² watershed.
Global organizations such as the World Meteorological Organization (WMO) and the Food and Agriculture Organization (FAO) rely on this conversion in rainfall reporting, hydrological manuals, and agricultural planning tools.
References for further reading: