Pump suction and discharge pressure are vital parameters ensuring efficiency, reliability, and safety in hydraulic systems. Accurate determination helps engineers select pumps, design piping, prevent cavitation, optimize consumption, and comply with standards.
Pump Suction & Discharge Pressure Calculator
Compute suction gauge/absolute pressure, NPSHa, and discharge gauge pressure from head. Supports SI & Imperial units.
What does positive/negative static suction mean?
What is NPSHa and why it matters?
Formulas used
ρ = SG × 1000 kg/m³.
Hydrostatic pressure (Pa) = ρ·g·h (g = 9.80665 m/s²).
Suction gauge pressure (Pa) = ρ·g·hs − ρ·g·hfs − ρ·g·(v²/2g if included).
Suction absolute pressure (Pa) = Patm + suction gauge pressure.
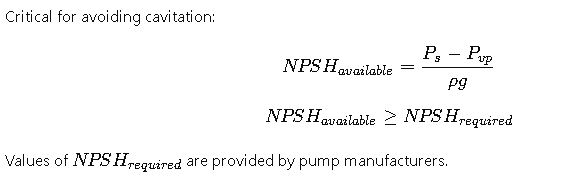
NPSHa (m) = (Psuction_abs − Pv)/(ρ·g).
Discharge gauge pressure from head: P (Pa) = ρ·g·H (convert to psi/bar/kPa).
Key Principles of Pump Suction and Discharge Pressure
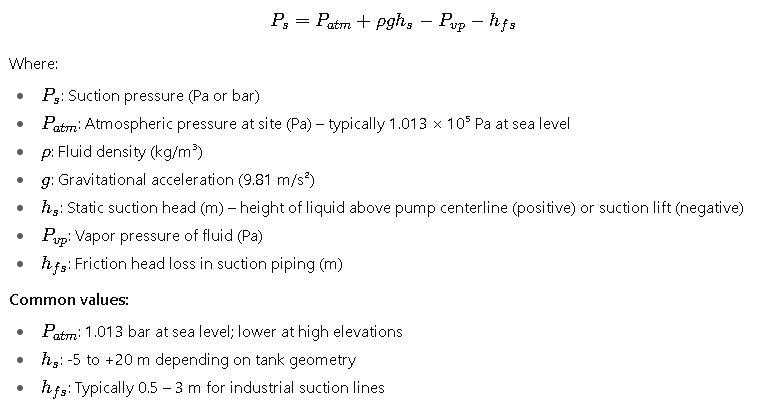
- Suction Pressure (Ps): The pressure at the pump inlet, influenced by liquid level, static head, atmospheric pressure, vapor pressure, and suction line losses.
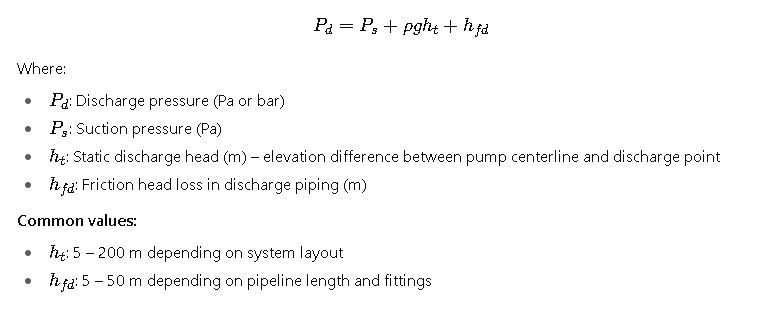
- Discharge Pressure (Pd): The pressure at the pump outlet, dependent on static head, system resistance, elevation, and downstream equipment requirements.
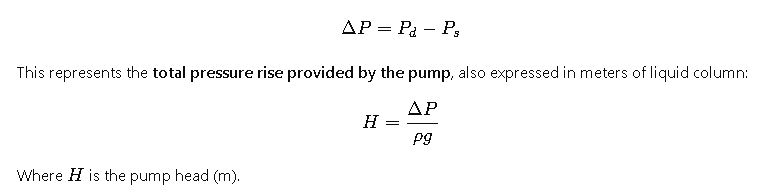
- Total Differential Pressure (ΔP): The difference between discharge and suction pressure, equivalent to the pump’s developed head.
Common Values Reference Tables
The following tables summarize typical values encountered in pump suction and discharge calculations. These tables serve as practical benchmarks for engineers during design and troubleshooting.
Table 1: Typical Suction Pressure Ranges for Industrial Applications
| Application | Suction Pressure (bar) | Notes |
|---|---|---|
| Water supply from open reservoir | 0.8 – 1.0 | Slightly below atmospheric, depending on NPSH margin |
| Cooling water intake (low lift) | 0.9 – 1.2 | Shallow suction from canals or rivers |
| Boiler feed pump suction | 5 – 25 | Pressurized deaerator tanks, high-temperature water |
| Crude oil pipeline booster | 2 – 10 | Suction header pressurized by upstream pumps |
| Seawater desalination intake | 1 – 2 | Ambient seawater conditions |
| Chemical process pump (reactor feed) | 3 – 15 | Depends on pressurized vessel design |
Table 2: Typical Discharge Pressure Ranges
| Application | Discharge Pressure (bar) | Notes |
|---|---|---|
| Domestic water booster | 2 – 6 | For multi-story building supply |
| Cooling water circulation | 3 – 10 | Distribution in industrial plants |
| Boiler feed pumps | 50 – 220 | High pressure to overcome boiler drum requirements |
| Crude oil transport pipeline | 30 – 100 | Long-distance pumping with booster stations |
| Reverse osmosis desalination system | 55 – 80 | To overcome membrane osmotic pressure |
| High-pressure chemical dosing | 20 – 100 | Controlled metering into reactors or pipelines |
Table 3: Commonly Used Fluid Properties for Pump Pressure Calculations
| Fluid | Density (kg/m³) | Vapor Pressure at 25°C (bar) | Notes |
|---|---|---|---|
| Water | 1000 | 0.031 | Reference fluid for pump testing |
| Seawater | 1025 | 0.031 | Slightly higher density |
| Crude oil (light) | 800 – 850 | 0.20 – 0.50 | Strongly dependent on API gravity |
| Diesel | 830 – 850 | 0.06 | Common fuel pumping |
| Sulfuric acid (98%) | 1830 | Negligible | Corrosive, requires special pump |
| Methanol | 791 | 0.17 | Flammable, low viscosity |
Fundamental Formulas for Suction and Discharge Pressure
Accurate calculation requires breaking down suction and discharge pressures into static, velocity, and friction components, governed by the Bernoulli equation and energy balance.
1. Suction Pressure (Ps)
2. Discharge Pressure (Pd)
3. Pump Differential Pressure (ΔP)
4. Net Positive Suction Head (NPSH)
Detailed Explanation of Key Variables in Pump Pressure Calculations
To accurately calculate suction and discharge pressure, engineers must evaluate several interdependent variables. Below are the most important parameters, explained in detail with typical ranges and industrial relevance.
Static Suction Head
This is the vertical distance between the pump centerline and the free surface of the liquid in the suction tank. A positive static suction head occurs when the liquid level is above the pump centerline, creating favorable suction conditions. Conversely, a negative value, known as suction lift, means the pump must draw liquid from below its centerline.
- Typical values: from –5 meters (lift) to +20 meters (flooded suction).
- Common in water treatment, cooling systems, and tank transfer operations.
Static Discharge Head
This is the vertical distance between the pump centerline and the final discharge point or tank surface. It represents the minimum energy the pump must supply to lift the liquid to its destination.
- Typical ranges: 5 to 200 meters depending on the system.
- High discharge heads are encountered in high-rise building water boosters and boiler feedwater systems.
Friction Losses
Frictional resistance arises in suction and discharge pipelines due to pipe roughness, fittings, valves, and bends. Engineers calculate this using friction loss equations or charts, but as a rule of thumb, friction losses can represent 5 to 20 percent of the total system head.
- Short suction lines: 0.5 to 2 meters of friction loss.
- Long discharge pipelines: 5 to 50 meters or more.
Fluid Density
The density of the liquid directly influences pressure calculations, since heavier fluids require more energy to be lifted.
- Water: 1000 kg/m³ (baseline).
- Seawater: 1025 kg/m³.
- Light hydrocarbons: 700 to 850 kg/m³.
- Heavy chemicals (sulfuric acid 98%): up to 1830 kg/m³.
Vapor Pressure
The vapor pressure defines the tendency of the liquid to vaporize at a given temperature. When the suction pressure approaches the vapor pressure, cavitation occurs inside the pump, leading to severe damage.
- Water at 25°C: 0.031 bar.
- Methanol: 0.17 bar.
- Hydrocarbons: often significantly higher, requiring careful design.
Atmospheric Pressure
At sea level, atmospheric pressure is approximately 1 bar. At higher altitudes, this value decreases, directly impacting suction pressure calculations. For example:
- Sea level: 1.013 bar.
- 2000 meters above sea level: ~0.79 bar.
- 4000 meters above sea level: ~0.62 bar.
This explains why pumps installed in high-altitude mines or industrial plants often face reduced suction performance and require derating or auxiliary pressurization systems.
Real-World Application Examples
To demonstrate the practical use of suction and discharge pressure calculations, the following case studies present detailed, step-by-step scenarios in different industries.
Case Study 1: Boiler Feed Pump in a Power Plant
Background:
In thermal power stations, boiler feed pumps must supply water at extremely high pressures to the boiler drum. This ensures continuous steam generation for turbines. The suction side of these pumps usually connects to a deaerator tank operating under pressure.
System Description:
- Suction source: pressurized deaerator tank, maintained at 8 bar.
- Fluid: treated boiler feedwater, density approximately 980 kg/m³ due to high temperature.
- Pump location: at grade level, deaerator located 15 meters above the pump.
- Discharge destination: boiler drum requiring 160 bar operating pressure.
- Suction line: short piping run with minimal losses.
- Discharge line: includes control valves and several kilometers of piping.
Suction Pressure Considerations:
Because the deaerator tank is pressurized, the suction pressure is relatively high, typically between 5 and 25 bar depending on plant design. This eliminates the risk of cavitation but imposes mechanical design requirements for pump casing and seals.
Discharge Pressure Considerations:
The pump must overcome the static elevation difference plus the boiler drum pressure. For this case, the discharge pressure typically reaches 160 to 200 bar. Such pumps are multistage designs, specifically engineered for high head service.
Engineering Insight:
Failure to maintain sufficient suction pressure leads to flashing of high-temperature water, even if the tank is pressurized. This can severely damage pump internals. Regular monitoring of suction conditions and control of deaerator pressure are mandatory.
Case Study 2: Seawater Reverse Osmosis (SWRO) Desalination Plant
Background:
Reverse osmosis plants require high-pressure pumps to force seawater through semi-permeable membranes, separating fresh water from brine. The discharge pressure must exceed the osmotic pressure of seawater.
System Description:
- Suction source: seawater intake basin at atmospheric pressure.
- Fluid: seawater, density 1025 kg/m³.
- Suction elevation: pump located at grade, water level 3 meters above pump centerline.
- Discharge requirement: 65 bar to overcome membrane osmotic pressure.
- Pipeline losses: estimated 5 bar in total discharge line.
Suction Pressure Considerations:
Since the pump is flooded from the intake basin, suction pressure is slightly above atmospheric. Suction friction losses must be minimized by using large-diameter, short-length piping.
Discharge Pressure Considerations:
The pump must deliver 65 bar at the membranes plus account for 5 bar of pipeline and valve losses. Therefore, discharge pressures reach approximately 70 bar.
Engineering Insight:
Cavitation risks are relatively low because seawater temperature is moderate, but material selection is critical due to chloride-induced corrosion. Duplex stainless steel or super austenitic alloys are often used in such pumps.
Design and Safety Considerations
Cavitation Prevention
Cavitation occurs when suction pressure falls below the vapor pressure of the liquid, generating vapor bubbles that collapse violently inside the pump. Preventing cavitation requires maintaining an adequate margin between available and required Net Positive Suction Head (NPSH).
Energy Efficiency
Overestimating discharge pressure leads to oversized pumps that consume excess energy, while underestimation risks inadequate flow and system instability. Correct calculation ensures optimal pump size and reduces lifecycle cost.
Standards and Guidelines
Engineers should refer to recognized standards for guidance:
- API 610: Centrifugal pumps for petroleum, petrochemical, and natural gas industries.
- ISO 5199: Technical specifications for class II centrifugal pumps.
- Hydraulic Institute Standards: Comprehensive methodology for pump system calculations.