The efficiency of wind turbines is evaluated using the power coefficient (Cp), a dimensionless efficiency indicator. Optimizing Cp is crucial in wind engineering, significantly affecting energy yield and economic feasibility of projects.
Wind Turbine Power Coefficient (Cp) Calculator
Calculate the aerodynamic power coefficient Cp from measured power, rotor geometry and wind speed. Includes tips, formula and related values.
Fundamentals of the Power Coefficient (Cp)
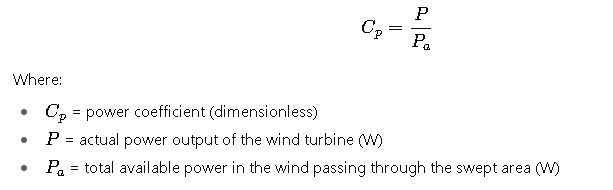
The power coefficient represents the ratio of actual power extracted by the wind turbine (P) to the total available power in the wind (Pₐ) passing through the rotor swept area.
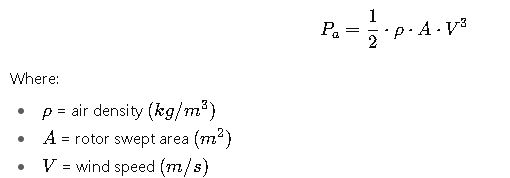
The available power in the wind is calculated as:
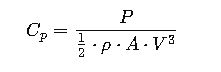
Thus, the complete Cp formula becomes:
Detailed Explanation of Variables
- Air Density (ρ)
- Standard value at sea level, 15°C: 1.225 kg/m³
- Varies with altitude, temperature, and humidity.
- Common values:
- 1.225 kg/m³ (sea level, 15°C)
- 1.18 kg/m³ (1000 m altitude)
- 1.12 kg/m³ (2000 m altitude)
- Swept Area (A)
- Defined as A=πR2 where R is the rotor radius.
- Larger blades exponentially increase energy capture.
- Example:
- Rotor radius 40 m → A = 5026.5 m²
- Rotor radius 80 m → A = 20,106.2 m²
- Wind Speed (V)
- Cubic relationship with power → small changes have huge impact.
- Measured at hub height.
- Typical operating range: 3 m/s (cut-in) to 25 m/s (cut-out).
- Power Output (P)
- Actual turbine output measured at generator.
- Depends on mechanical/electrical losses in addition to aerodynamics.
Betz Limit and Theoretical Maximum Cp
No turbine can extract 100% of wind energy due to physical laws of fluid dynamics. According to Betz’s Law (1919), the maximum theoretical Cp is:
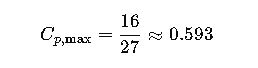
This means that at most 59.3% of the wind’s kinetic energy can be converted into mechanical energy.
Modern turbines typically achieve Cp values in the range of 0.40 – 0.50, approaching but never surpassing the Betz limit.
Extended Table of Common Cp Values in Wind Turbines
Below is a detailed reference table showing Cp values for different turbine designs, blade configurations, and operating conditions. These values are compiled from academic studies, IEC standards, and field data.
| Turbine Type / Condition | Typical Cp Range | Notes |
|---|---|---|
| Ideal Betz Limit | 0.593 | Absolute theoretical maximum. |
| Modern 3-blade Horizontal Axis (HAWT) | 0.45 – 0.50 | State-of-the-art commercial turbines (Vestas, Siemens Gamesa). |
| 2-blade HAWT | 0.38 – 0.45 | Slightly lower efficiency but cheaper structure. |
| 1-blade HAWT (rare) | 0.30 – 0.35 | Not commercially viable, mainly experimental. |
| Vertical Axis Turbine (Savonius) | 0.15 – 0.20 | Very low Cp, used for small-scale or niche applications. |
| Vertical Axis Turbine (Darrieus) | 0.25 – 0.35 | Moderate Cp, simple design. |
| Offshore Large-Scale (>10 MW) | 0.48 – 0.50 | Optimized aerodynamics, advanced blade pitch control. |
| Small Onshore (<100 kW) | 0.35 – 0.40 | Efficiency limited by cost and simplified design. |
| At Cut-in Speed (≈3 m/s) | 0.10 – 0.20 | Low aerodynamic efficiency at startup. |
| At Rated Speed (≈12–15 m/s) | 0.45 – 0.50 | Maximum efficiency operation zone. |
| Near Cut-out (≈25 m/s) | <0.10 | Blades feathered, minimal energy capture for protection. |
Step-by-Step Calculation Example
Let’s calculate Cp for a modern 2 MW onshore turbine operating at rated conditions.
Given Data:
- Rated Power Output P= 2,000,000 W
- Rotor Radius R= 50 m
- Air Density ρ = 1.225 kg/m³
- Wind Speed V= 12 m/s
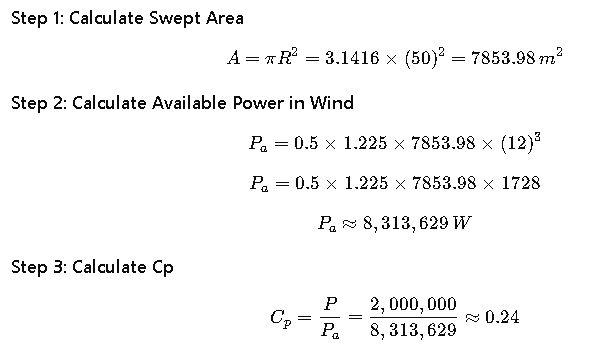
This indicates the turbine at this operating point is below optimal efficiency. At rated power, many turbines intentionally cap output to protect components, hence Cp is lower than peak values.
Real-World Application Case 1: Offshore Wind Farm
A Siemens Gamesa 14 MW offshore turbine is evaluated for Cp performance.
- Rated Output: 14,000,000 W
- Rotor Diameter: 222 m → Radius = 111 m
- Air Density: 1.225 kg/m³ (sea level)
- Wind Speed: 12 m/s
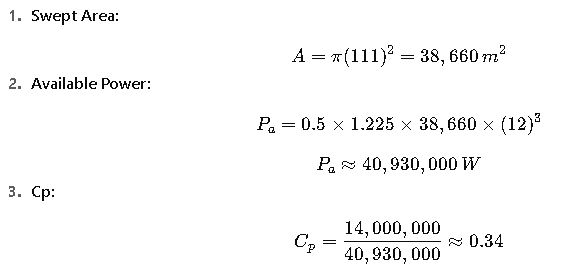
This Cp is consistent with large offshore turbines, which prioritize stability and reliability over maximum aerodynamic efficiency.
Real-World Application Case 2: Small Urban Vertical Axis Turbine
A 5 kW Darrieus VAWT in an urban environment:
- Rated Output: 5,000 W
- Rotor Radius: 3 m
- Swept Area (approximate elliptical area): A=H×D=6×6=36m2
- Wind Speed: 8 m/s
- Air Density: 1.2 kg/m³
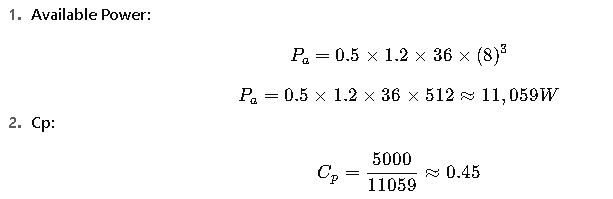
Despite being a vertical axis turbine, its Cp is relatively high because small turbines can be optimized for specific operating conditions.
Extended Reference Tables of Cp Values by Operating Conditions
While the earlier table summarized turbine types, engineers often need granular reference values under varying wind conditions, rotor sizes, and turbine control strategies. Below is a more detailed dataset.
Cp vs. Wind Speed for a Typical 3-MW HAWT
| Wind Speed (m/s) | Available Power (MW) | Actual Output (MW) | Cp |
|---|---|---|---|
| 3 (cut-in) | 0.10 | 0.02 | 0.20 |
| 5 | 0.47 | 0.15 | 0.32 |
| 7 | 1.29 | 0.55 | 0.43 |
| 9 | 2.66 | 1.20 | 0.45 |
| 11 | 4.95 | 2.30 | 0.46 |
| 13 | 8.40 | 3.00 (rated) | 0.36 |
| 15 | 13.05 | 3.00 (limited) | 0.23 |
| 20 (cut-out) | 30.84 | 0.00 | 0.00 |
This table demonstrates that Cp peaks around rated wind speed but decreases when turbines limit power output to protect components.
Cp vs. Rotor Diameter for Modern Turbines
| Rotor Diameter (m) | Rated Power (MW) | Typical Cp Range | Notes |
|---|---|---|---|
| 40 | 0.5 – 1.0 | 0.35 – 0.40 | Early small-scale HAWTs. |
| 80 | 1.5 – 2.5 | 0.40 – 0.45 | Common onshore turbines in the 2000s. |
| 120 | 3 – 5 | 0.44 – 0.48 | Current industry average for onshore. |
| 150 – 170 | 6 – 10 | 0.46 – 0.49 | Offshore-focused, high efficiency. |
| 200+ | 12 – 15+ | 0.47 – 0.50 | Flagship offshore turbines today. |
As turbine size increases, design improvements in blade aerodynamics and control systems allow higher Cp values, but never beyond the Betz limit.
Real-World Influences on Cp
While formulas give theoretical Cp values, actual performance is affected by several real-world factors. Engineers and developers must account for these when designing, selecting, or operating turbines.
1. Atmospheric Conditions
- Altitude: Higher altitude reduces air density, lowering available power and Cp values.
- Temperature: Cold climates improve efficiency (denser air), while hot tropical climates reduce it.
- Humidity: Humid air is lighter than dry air, marginally lowering Cp.
2. Terrain and Turbulence
- Flat, open terrains (plains, offshore) allow turbines to achieve Cp near optimal values.
- Complex terrains (urban, mountainous) create turbulence, which reduces aerodynamic efficiency and lowers Cp.
3. Turbine Age and Maintenance
- Blade erosion, dirt accumulation, and misalignment reduce Cp over time.
- Regular cleaning and pitch/yaw calibration can improve efficiency by 3–7%.
4. Control Strategy
- Fixed-pitch turbines: Simpler, cheaper, but lower Cp under variable winds.
- Variable-pitch turbines: Adjust blade angle dynamically to maximize Cp at any given speed.
- Yaw control: Ensures rotor faces the wind; poor yaw alignment can cut Cp by 10–15%.
International Standards for Cp Evaluation
Several standards guide the accurate measurement and reporting of Cp in the wind industry:
- IEC 61400-12-1 (International Electrotechnical Commission): Defines methods for power performance measurement of electricity-producing wind turbines.
- ISO 2533: Standard atmosphere reference, crucial for air density correction in Cp calculations.
- DNV-GL Guidelines: Provide certification frameworks for aerodynamic efficiency testing.
Following these standards ensures consistency across manufacturers and comparability in performance data.
Practical Engineering Applications of Cp
Wind Farm Design
When planning a wind farm, engineers use Cp data to estimate annual energy production (AEP). A higher Cp directly improves project bankability and return on investment.
Grid Integration
Stable Cp ensures predictable turbine output, which is critical for grid operators balancing renewable inputs with conventional power plants.
Turbine Selection
Cp values influence the choice of turbines for a site:
- Low wind speed sites → larger rotors with higher Cp at low speeds.
- High wind speed sites → smaller rotors or capped Cp to avoid oversizing.
Case Studies from the Field
Offshore Denmark – Hornsea Project One
This massive offshore farm employs 7 MW Siemens turbines with Cp consistently around 0.47 in optimal conditions. By maximizing Cp, the farm supplies power to over 1 million homes while maintaining efficiency in a high-turbulence offshore environment.
Onshore India – Gujarat Wind Corridor
Here, Cp values are lower (0.38 – 0.42) due to hot temperatures and lower air density. Despite this, optimization through larger rotors and modern pitch control systems ensures competitive electricity generation.
Future Trends in Cp Optimization
- Smart Blade Technology
- Blades with embedded sensors and adaptive geometry adjust in real time to maintain optimal Cp.
- AI-driven Yaw and Pitch Control
- Machine learning predicts wind turbulence, optimizing alignment and blade angle.
- Floating Offshore Turbines
- Designed for deep-water deployment, where winds are stronger and steadier, improving Cp consistency.
- Hybrid Systems
- Combining wind turbines with solar panels or battery storage allows better use of Cp-optimized output.
Key Takeaways for Engineers and Developers
- Cp is the cornerstone metric for evaluating turbine aerodynamic efficiency.
- The Betz limit (0.593) defines the upper bound, but real-world turbines typically achieve 0.40 – 0.50.
- Cp depends not only on blade design and wind speed but also on maintenance, control systems, and site conditions.
- Extended tables of Cp across speeds and rotor sizes provide benchmarks for comparison.
- Following IEC standards ensures reliable Cp measurement and reporting.
- Emerging technologies such as AI controls and smart blades will push Cp values closer to theoretical limits.