The capacity factor measures how efficiently a wind turbine converts wind energy into electrical power over time.
Accurate calculation is essential for developers, investors, and engineers, influencing project feasibility, yield, and grid integration.
Wind Turbine Capacity Factor Calculator
Extensive Table: Common Capacity Factors by Wind Turbine Type, Size, and Location
| Turbine Model / Type | Rated Power (MW) | Average Wind Speed (m/s) | Location Type | Typical Capacity Factor (%) | Annual Energy Output (MWh) |
|---|---|---|---|---|---|
| GE 2.5-120 (Onshore) | 2.5 | 7.5 | Flatland, rural | 35 – 38 | ~8,000 – 8,400 |
| Siemens SWT-3.6-120 (Offshore) | 3.6 | 9.0 | Offshore | 42 – 48 | ~13,000 – 15,100 |
| Vestas V150-4.2 MW (Onshore) | 4.2 | 8.5 | Coastal ridge | 40 – 45 | ~14,700 – 16,500 |
| Enercon E-126 EP3 (Onshore) | 4.0 | 6.5 | Inland plateau | 30 – 33 | ~10,500 – 11,500 |
| Nordex N149/5.X (Onshore) | 5.5 | 8.0 | Hillside | 37 – 41 | ~17,800 – 19,800 |
| Haliade-X 12 MW (Offshore) | 12 | 10.5 | Deep sea | 50 – 60 | ~52,600 – 63,000 |
Source references: IEA Wind TCP, NREL Turbine Database
Formulas Used to Calculate Capacity Factor in Wind Turbines
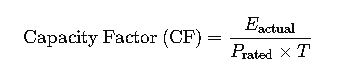
The capacity factor (CF) quantifies the actual energy output of a wind turbine compared to its maximum possible output over a given period.
Primary Formula:
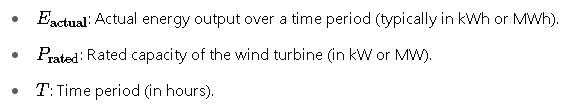
Where:
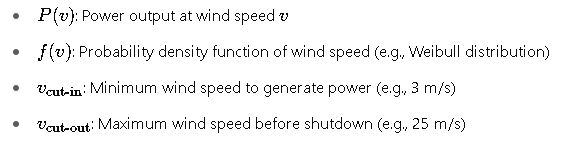
Extended Calculation: Using Wind Speed and Power Curve
In the absence of actual energy data, capacity factor can be estimated from wind speed distribution and the turbine’s power curve.
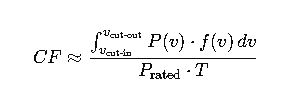
Where:
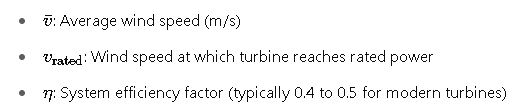
Simplified Estimate Using Average Wind Speed (for early-stage feasibility):
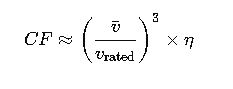
Where:
This is a rough estimate, useful for early project screening.
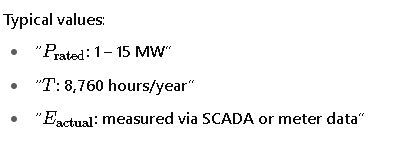
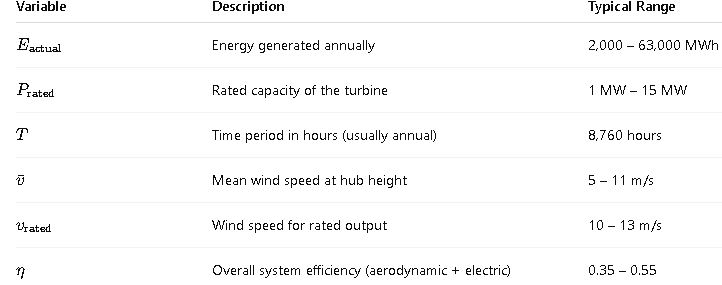
Variables and Typical Values Explained
Real-World Example 1: Onshore Wind Turbine in Texas, USA
Turbine: Vestas V136-3.6 MW
Location: West Texas plateau
Average Wind Speed: 7.8 m/s
Rated Power: 3.6 MW
Annual Output: 11,500 MWh (from SCADA data)
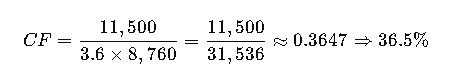
Interpretation:
This is a solid performance for onshore conditions. The relatively high mean wind speed and lack of wake loss due to optimal spacing contribute to this capacity factor.
Real-World Example 2: Offshore Wind Farm in the North Sea
Turbine: Siemens Gamesa SG 8.0-167 DD
Rated Power: 8 MW
Number of Turbines: 100
Average Wind Speed: 10.2 m/s
Estimated Annual Output per Turbine: 38,000 MWh
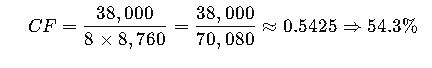
Interpretation:
This high capacity factor is typical of North Sea offshore farms, driven by consistent strong wind regimes, fewer interruptions, and improved turbine technology.
Factors Affecting Capacity Factor in Wind Turbines
- Wind Resource Quality:
- Most critical factor.
- Coastal and offshore sites yield higher CF due to stronger, more consistent winds.
- Turbine Design:
- Rotor diameter, generator rating, cut-in/out speeds impact power curve.
- Higher hub heights capture stronger wind layers.
- Control Systems:
- Pitch and yaw optimization ensures better wind tracking.
- Maintenance and Downtime:
- Lower availability (downtime) reduces actual generation.
- Wake Effects:
- Poor spacing between turbines causes turbulence and energy loss.
- Grid Curtailments:
- Overgeneration or grid instability may require temporary shutoffs.
- Altitude and Air Density:
- Air density affects kinetic energy in the wind. Lower at high altitudes or temperatures.
Recommended Design and Siting Strategy to Maximize Capacity Factor
- Conduct a comprehensive wind resource assessment with at least 1–2 years of met mast or LiDAR data.
- Use high capacity factor models in low-wind areas (e.g., high-capacity low-speed turbines).
- Optimize layout to minimize wake losses.
- Choose turbine hub heights that exceed local terrain roughness.
- Integrate predictive maintenance and SCADA monitoring to reduce downtime.
Normative and Industry References
- IEC 61400-12-1 – Power Performance Measurements of Electricity Producing Wind Turbines
- IEC 61400-1 – Design Requirements for Wind Turbines
- NREL Wind Integration National Dataset (WIND)
- IEA Wind TCP Reports
- American Clean Power (ACP) Database
These standards and datasets provide internationally recognized frameworks for modeling and validating capacity factor estimates.
Further Resources and External Links
- National Renewable Energy Laboratory (NREL)
- IEA Wind TCP
- Global Wind Energy Council (GWEC)
- DNV Guidelines for Wind Resource Assessment
Real-World Example 3: Mountainous Terrain Wind Farm in Chile
Turbine: Nordex N133/4.8 MW
Location: Andes foothills, Chile
Average Wind Speed: 6.2 m/s
Altitude: ~1,800 meters above sea level
Annual Output (from SCADA): 10,250 MWh
Rated Power: 4.8 MW
Adjusted air density (ρ) at 1,800 m: ~1.00 kg/m³ (vs 1.225 kg/m³ at sea level)
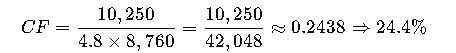
Key Observations:
- Reduced air density negatively impacts energy capture.
- Hilly terrain causes turbulence, impacting energy yield.
- This case highlights the need to factor in local atmospheric conditions during feasibility studies.
Capacity Factor vs. Utilization Factor: Clarifying the Distinction
These two terms are often mistakenly interchanged. While related, they serve different engineering and economic purposes:
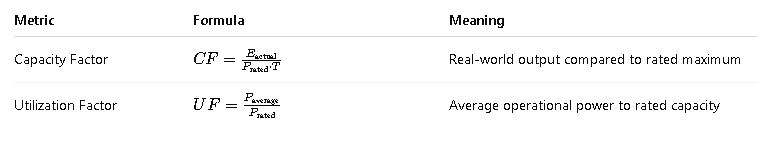
For wind turbines, CF and UF may converge over large datasets but differ over short timeframes due to wind variability.
Sensitivity Analysis: How Uncertainty Affects Capacity Factor Projections
Understanding how variation in key parameters impacts capacity factor is critical for risk assessment and project finance. Common variables include:
1. Wind Speed Variability
- A ±0.5 m/s deviation in annual mean wind speed can cause a ±10–15% change in CF due to the cubic relationship between power and wind speed.
2. Turbine Downtime (Availability)
Where A is turbine availability (e.g., 0.96 for 96% uptime)
- If availability drops from 98% to 92%, CF can fall by 6–8%.
3. Wake Losses
- Poorly spaced layouts can result in up to 20% CF loss.
- Simulation tools like OpenWind, WindPro, or WAsP should be used during layout planning.
Visualization Tools: Representing Capacity Factor and Wind Characteristics
Effective visualization enhances stakeholder understanding and decision-making.
| Tool | Purpose |
|---|---|
| Wind Rose | Shows wind direction and frequency distributions |
| Histogram of Wind Speeds | Visualizes occurrence of speed ranges |
| Power Duration Curve | Illustrates % of time spent generating certain power levels |
| Annual Energy Yield Chart | Compares actual vs. potential output |
These can be implemented in tools such as Python (matplotlib), Excel, or GIS-based platforms.
Comparison of Capacity Factor Across Energy Sources
| Technology | Typical Capacity Factor (%) | Notes |
|---|---|---|
| Wind (Onshore) | 25 – 45 | Site-dependent, subject to intermittency |
| Wind (Offshore) | 40 – 60 | Higher wind speeds, less turbulence |
| Solar PV | 10 – 25 | Daylight-limited, weather-dependent |
| Natural Gas (CCGT) | 40 – 80 | Dispatchable, fuel-cost dependent |
| Nuclear | 80 – 95 | Baseload, very high uptime |
| Hydro (Run-of-river) | 30 – 50 | Seasonal variation, location-sensitive |
Wind energy’s intermittency is offset by its low operating costs and improving forecast technologies.
Best Practices for Capacity Factor Optimization
- Early-stage wind resource assessment using multi-year LiDAR or meteorological masts.
- Digital twin modeling for turbine performance forecasting.
- Advanced SCADA analytics for loss detection and uptime maximization.
- Battery storage integration to enhance dispatchability and reduce curtailment.
- Ongoing re-optimization of yaw/pitch settings via AI/ML algorithms.
Tools and Software Used in Capacity Factor Modeling
| Software | Application |
|---|---|
| WAsP | Wind resource assessment and energy yield calculation |
| WindPro | Layout, noise, shadow flicker, yield estimation |
| OpenWind | Advanced wake modeling and turbine siting |
| HOMER Energy | Hybrid system modeling (wind + solar + storage) |
| MATLAB / Python | Custom simulations, sensitivity analyses, time series |
These tools enable data-driven, bankable CF estimations used in pre-construction energy yield assessments.
Regulatory and Certification Frameworks
To ensure credible capacity factor calculations, industry standards and certifications are essential:
- IEC 61400-12-1: Power performance testing standard (site-specific or type-specific)
- DNV GL: Yield validation and third-party bankability assessments
- AEP (Annual Energy Production) Reports: Standard deliverables for wind farm projects
- ISO 50001: Energy management standard applicable to wind project operations
Adhering to these ensures transparency and stakeholder confidence in capacity projections.
Final Notes
Calculating the capacity factor in wind turbines is far more than a simple division of energy over rated power—it involves sophisticated resource analysis, technical modeling, and operational monitoring. Engineers, developers, and analysts must approach this metric with a holistic mindset, incorporating both aerodynamic modeling and real-time operational insights to optimize performance and profitability.
With renewable penetration accelerating worldwide, improving and refining capacity factor estimation techniques is vital for robust energy planning, especially in hybrid systems, grid integration strategies, and carbon offset verification frameworks.