The A260/A280 ratio is crucial for evaluating nucleic acid purity in molecular biology laboratories.
This guide explains the ratio’s calculation, offering formulas, reference tables, examples, and expert interpretations.
A260/A280 Ratio Calculator
Common A260/A280 Ratio Values for Nucleic Acids
The table below displays the most commonly observed A260/A280 ratios for DNA and RNA samples along with their purity implications. These reference values are derived from empirical data in accordance with the current laboratory best practices.
| Sample Type | A260/A280 Ratio | Purity Assessment | Possible Contaminants |
|---|---|---|---|
| Pure DNA | ~1.8 | Ideal for molecular biology protocols | Low contamination |
| Pure RNA | ~2.0 | High purity for transcription assays | Low contamination |
| < 1.6 | Low | Significant protein contamination | Proteins, phenol, guanidine |
| 1.6 – 1.7 | Sub-optimal | Mild protein contamination | Residual proteins |
| > 2.1 | High | Possible RNA contamination in DNA | RNA, phenol, ethanol |
| ~1.5 (ssDNA) | Acceptable | Single-stranded DNA | Less ideal for PCR |
| > 2.2 | Questionable | Contamination or measurement error | Solvent, buffer interference |
Note: Consistent results require clean cuvettes, calibrated spectrophotometers, and proper blanking with the elution buffer.
Formulas Used for A260/A280 Ratio Calculation
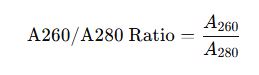
1. Core Equation
The absorbance ratio is calculated using:
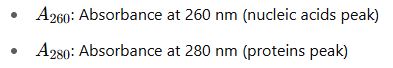
Where:
Instrumental Considerations:
- Measurements are taken using a UV-Vis spectrophotometer or microvolume platforms like NanoDrop™.
- Use quartz cuvettes for accuracy if not using microvolume tech.
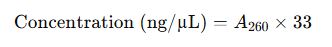
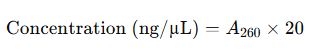
2. Nucleic Acid Concentration Formulas
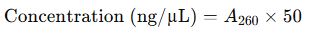
For Double-Stranded DNA (dsDNA):
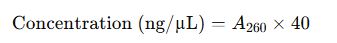
For RNA:
For Single-Stranded DNA (ssDNA):
For Oligonucleotides:
Ensure dilution factor is included if applicable:

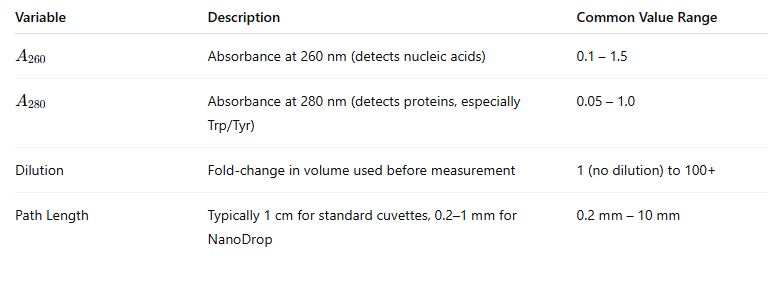
Explanation of Key Variables
Common Reference Standards and Normative Sources
The purity thresholds and interpretation of the A260/A280 ratio are supported by:
- MIQE Guidelines: Minimum Information for Publication of Quantitative Real-Time PCR Experiments
- Thermo Fisher Scientific NanoDrop™ Protocols
- NIH Research Guidelines: Recommended A260/A280 purity metrics for RNA integrity and DNA prep.
- ISO 20387:2018 (Biotechnology – Biobanking standards)
Real-World Example #1: DNA Extraction from Blood
Scenario: A researcher extracts genomic DNA from peripheral blood using a silica column protocol and measures:
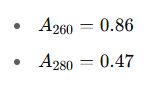
Step-by-step calculation:
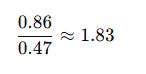
- Calculate A260/A280:
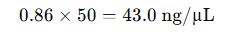
- Concentration:
- Interpretation:
- The A260/A280 ratio of 1.83 is close to the ideal 1.8, indicating pure DNA.
- Concentration is within usable range for PCR and gel electrophoresis.
- Action:
- Sample is considered acceptable for downstream genotyping and PCR protocols.
Real-World Example #2: RNA Extraction from Plant Tissue
Scenario: A molecular biologist extracts total RNA from Arabidopsis thaliana leaves using TRIzol™ reagent and measures:

Step-by-step calculation:
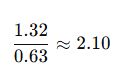
- Calculate A260/A280:
- RNA Concentration (undiluted):
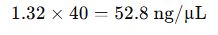
- Adjusted for Dilution:
- Interpretation:
- A260/A280 of 2.10 suggests high-purity RNA, slightly above ideal (2.0), but acceptable.
- Could indicate traces of phenol, common in TRIzol protocols.
- The high concentration is optimal for reverse transcription or RNA-seq.
- Action:
- Sample may be treated with an additional ethanol precipitation step if downstream sensitivity to phenol is a concern.
Best Practices to Ensure Reliable A260/A280 Measurements
Accurate measurement of A260/A280 ratios is contingent on rigorous lab technique. Follow these guidelines:
Do:
- Use RNAse/DNAse-free consumables
- Blank the instrument with the same buffer used in elution
- Measure triplicates and take average
- Keep samples free from bubbles, fingerprints, or residual solvents
Avoid:
- Measuring too diluted samples (A260 < 0.1) – signal-to-noise is too low
- Using plastic cuvettes for UV – they absorb at 260 nm
- Failing to account for dilution factor – leads to underestimation
Factors Affecting the A260/A280 Ratio
| Factor | Impact | Mitigation Strategy |
|---|---|---|
| Phenol contamination | Artificially raises 260 and 280, may skew ratio | Use phenol-free methods or purification |
| Protein contamination | Increases A280, lowers the ratio | Proteinase K treatment |
| Buffer interference | Some buffers (Tris, EDTA) absorb in UV range | Use water or compatible low-UV buffers |
| RNA contamination in DNA | Increases A260, causes ratio > 2.0 | Treat DNA with RNase A |
| Dirty cuvettes or tips | Creates random absorbance artifacts | Clean with ethanol or replace |
| Light path inconsistency | Results in fluctuating readings | Use consistent volume and calibrated optics |
Interpreting Unusual A260/A280 Ratios
Sometimes ratios fall outside the expected ranges, and understanding their meaning is critical.
| Ratio Range | Likely Meaning | Recommended Action |
|---|---|---|
| < 1.5 | High protein contamination | Re-extract or treat with proteinase |
| 1.6–1.7 | Partial contamination or degraded sample | Use cautiously or re-purify |
| 1.8–2.0 | Pure DNA/RNA | Acceptable for most applications |
| > 2.1 | Possible RNA in DNA, or phenol contamination | Treat with RNase or re-purify via column |
| > 2.2 | Measurement error or severe contamination | Repeat measurement with blank calibration |
Integration into Modern Molecular Workflows
The A260/A280 ratio is not a standalone indicator. Combine it with:
- A260/A230 ratio (ideal ~2.0–2.2): detects carbohydrate, phenol, or guanidine contamination
- RNA Integrity Number (RIN) from Bioanalyzer: ensures transcript quality
- Fluorometric methods (e.g., Qubit™): provide accurate quantification
For clinical labs and biobanks, compliance with ISO 20387:2018 and OECD Guidelines recommends dual metrics: A260/A280 and integrity assays for nucleic acid quality assurance.
Useful Online Resources
- Thermo Fisher NanoDrop Applications
- QIAGEN Nucleic Acid Purity Guide
- PubMed Central: Quantitation of Nucleic Acids
- OECD Biobanking Guidelines
Summary Table: A260/A280 Ideal Values by Application
| Application | Sample Type | Ideal A260/A280 | Comments |
|---|---|---|---|
| PCR/Genotyping | DNA | ~1.8 | Must be free of protein and phenol |
| Reverse Transcription (RT) | RNA | ~2.0 | Integrity is more critical than purity |
| Microarray or RNA-seq | RNA | ≥ 2.0 | Also check RIN > 7 |
| Cloning/Transformation | Plasmid DNA | 1.8–2.0 | Ensure absence of RNA contamination |
| qPCR (SYBR/Probe) | RNA/DNA | ~1.8–2.0 | Confirm no inhibitors (salts, proteins) |
| Protein expression (DNA template) | DNA | 1.7–1.9 | Best with highly pure dsDNA |