Aquaculture is expanding rapidly, and precise stocking density calculations ensure survival, growth, profitability, and efficient feed utilization. Improper density management increases oxygen depletion, ammonia accumulation, stress, disease outbreaks, and significantly raises operational financial risks.
Aquaculture Stocking Density Calculator
Understanding Stocking Density in Aquaculture
Stocking density is typically expressed as:
- Number of fish per unit volume (fish/m³) in tanks, raceways, or RAS.
- Number of fish per unit surface area (fish/m² or fish/ha) in earthen ponds.
- Sometimes, biomass per volume (kg/m³) is used, especially in intensive systems.
The stocking density directly affects:
- Growth rate and feed conversion ratio (FCR)
- Dissolved oxygen consumption
- Accumulation of metabolites (CO₂, NH₃, NO₂⁻)
- Stress levels and disease susceptibility
- Final production per cycle
Extensive Stocking Density Tables for Ponds and Tanks
The following tables summarize commonly accepted stocking density ranges for major aquaculture species. These values are based on guidelines from FAO, World Aquaculture Society (WAS), and regional extension manuals.
Table 1. Typical Stocking Densities in Ponds (Extensive, Semi-Intensive, Intensive)
| Species | Extensive (fish/ha) | Semi-Intensive (fish/ha) | Intensive (fish/ha) | Optimal Biomass (kg/ha) |
|---|---|---|---|---|
| Tilapia (Oreochromis spp.) | 2,000 – 5,000 | 10,000 – 25,000 | 50,000 – 100,000 | 2,000 – 10,000 |
| Common Carp (Cyprinus carpio) | 1,000 – 3,000 | 5,000 – 10,000 | 15,000 – 30,000 | 1,500 – 6,000 |
| Catfish (Clarias spp., Ictalurus spp.) | 2,500 – 5,000 | 15,000 – 30,000 | 40,000 – 80,000 | 3,000 – 8,000 |
| Shrimp (Penaeus spp.) | 10 – 30/m² | 30 – 60/m² | 100 – 300/m² | 2,000 – 15,000 kg/ha |
| Milkfish (Chanos chanos) | 1,000 – 2,000 | 5,000 – 10,000 | 20,000 – 40,000 | 1,000 – 5,000 |
Table 2. Typical Stocking Densities in Tanks/RAS
| Species | Low-Intensity (kg/m³) | Moderate-Intensity (kg/m³) | High-Intensity (kg/m³) | Notes |
|---|---|---|---|---|
| Tilapia | 5 – 10 | 20 – 40 | 60 – 100 | Oxygen and filtration critical |
| Trout (Oncorhynchus spp.) | 10 – 20 | 30 – 40 | 60 – 80 | High DO demand |
| Salmon (Salmo salar) | 15 – 25 | 40 – 60 | 80 – 120 | Strict water quality control |
| Catfish (Clarias spp.) | 10 – 20 | 40 – 60 | 80 – 120 | Common in RAS |
| Shrimp (Litopenaeus spp.) | 5 – 10 | 15 – 25 | 30 – 50 | Biofloc systems allow higher densities |
These tables provide baseline values; real-world application requires calculator-based fine-tuning using system volume, oxygen input, and target biomass.
Formulas for Aquaculture Stocking Density Calculations
Stocking density calculators rely on a series of fundamental equations that integrate pond/tank dimensions, biomass, survival rate, and growth performance.
Formula 1. Stocking Density in Ponds (per area)
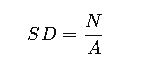
Where:
- SD = Stocking density (fish/m² or fish/ha)
- N = Number of fingerlings stocked
- A = Pond surface area (m² or ha)
Formula 2. Stocking Density in Tanks (per volume)
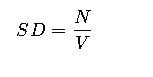
Where:
- SD = Stocking density (fish/m³)
- N = Number of fingerlings stocked
- V = Tank volume (m³)
Formula 3. Biomass Density
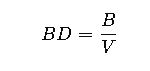
Where:
- BD = Biomass density (kg/m³)
- B = Total biomass of fish (kg)
- V = Pond or tank volume (m³)
Formula 4. Adjusted Stocking Based on Survival Rate
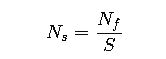
Where:
- N_s = Number of fingerlings to stock initially
- N_f = Desired number of fish at harvest
- S = Expected survival rate (decimal; e.g., 0.85 for 85%)
Formula 5. Oxygen-Based Carrying Capacity
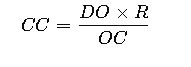
Where:
- CC = Carrying capacity (kg/m³)
- DO = Dissolved oxygen available (mg/L)
- R = Water renewal or aeration efficiency factor
- OC = Oxygen consumption per kg of fish (mg O₂/kg/hour)
This formula ensures that stocking density does not exceed the oxygen supply capacity of the system.
Formula 6. Maximum Feeding Rate–Based Calculation
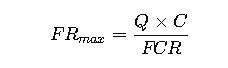
Where:
- FRₘₐₓ = Maximum feeding rate (kg feed/day)
- Q = Daily water exchange (m³/day)
- C = Maximum safe nutrient load (kg/m³)
- FCR = Feed conversion ratio
This formula links stocking density to feed input and nutrient assimilation capacity.
Explanation of Variables and Typical Values
- DO (Dissolved Oxygen): Optimal range 5–7 mg/L; critical below 3 mg/L.
- OC (Oxygen Consumption): Tilapia ~200–400 mg O₂/kg/h; Trout ~500–600 mg O₂/kg/h.
- Survival Rate (S): Extensive ponds 70–80%; intensive tanks with RAS >90%.
- FCR: Tilapia ~1.5; Trout ~1.1; Shrimp ~1.8.
- Tank Volume (V): Common ranges: 10–50 m³ for small tanks; >500 m³ in RAS.
- Pond Area (A): Small-scale 0.1–0.5 ha; commercial 1–5 ha.
Real-World Examples
Case Study 1. Tilapia in a Semi-Intensive Pond
- Pond size: 1 ha (10,000 m²)
- Target harvest biomass: 5,000 kg
- Average harvest weight: 500 g (0.5 kg)
- Expected survival rate: 85%
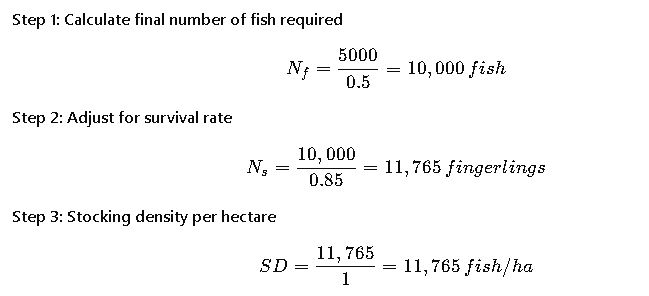
Result: A semi-intensive stocking density of ~12,000 fish/ha matches Table 1 ranges.
Case Study 2. Trout in a Tank-Based RAS
- Tank volume: 20 m³
- Target biomass: 600 kg at harvest
- Average fish weight at harvest: 300 g (0.3 kg)
- Expected survival rate: 90%
- Oxygen supply capacity: 6 mg/L, with efficient aeration
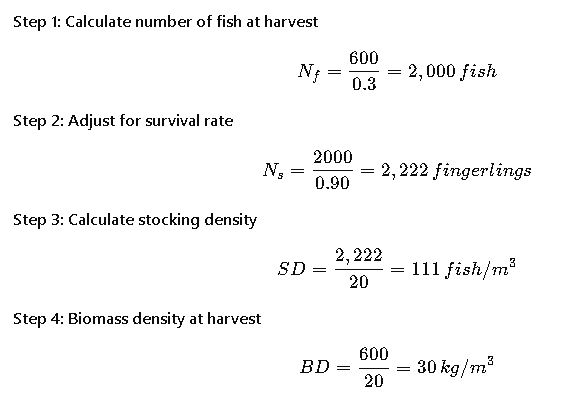
Result: With 30 kg/m³, this system operates in a moderate-intensity trout range, requiring continuous oxygen monitoring.
Importance of Regulatory and Scientific Standards
Stocking density guidelines are influenced by:
- FAO Code of Conduct for Responsible Fisheries
- World Aquaculture Society Best Management Practices (BMPs)
- Regional aquaculture regulations (e.g., USDA NRCS Aquaculture Standards, EU EFSA reports)
References: