Designing reliable Wi-Fi networks requires more than access point placement; accurate sizing ensures optimal performance everywhere. This expert guide covers AP sizing with tables, parameters, applications, and real-world deployment considerations in detail.
Wi‑Fi AP & Network Sizing Calculator
Estimate the number of access points (APs), total required backhaul and coverage recommendations quickly — optimized for planners and network engineers.
How does concurrency affect AP count?
What is effective AP throughput?
Formulas used
Aggregate required throughput (Mbps) = active users × per‑user Mbps × overhead multiplier.
Required backhaul ≈ Aggregate throughput (rounded).
APs (by throughput) = ceil( Aggregate throughput / effective AP throughput ).
APs (by coverage) = ceil( coverage area / m² per AP ). Final recommended APs = max(APs by throughput, APs by coverage) then add reserve % for redundancy.
Why coverage and capacity both matter?
Why Wi-Fi Network Sizing Matters
Undersized Wi-Fi networks lead to poor performance, dropped connections, high latency, and throughput collapse during peak loads. Oversized networks, on the other hand, result in excessive capital expenditure (CAPEX) and unnecessary operational costs. Correct sizing balances both aspects, ensuring:
- Adequate coverage (signal strength across the service area).
- Capacity matching (supporting the intended number of simultaneous users).
- Performance consistency (maintaining throughput as devices scale).
- Resiliency and scalability (supporting growth without major redesign).
Organizations such as IEEE 802.11 working groups, Wi-Fi Alliance, and design guidelines from vendors like Cisco, Aruba, and Ruckus all emphasize rigorous AP sizing methodology.
Common Parameters in Wi-Fi Network Sizing
Before diving into calculations, let’s examine the core parameters. The following table provides a structured reference of the most frequently used variables, their typical values, and common industry assumptions.
Table 1. Common Parameters for Wi-Fi Network Sizing
| Parameter | Symbol | Typical Values / Ranges | Description |
|---|---|---|---|
| Number of Users | U | 50 – 10,000+ | Total clients expected to connect in the coverage area. |
| Concurrency Factor | Cf | 0.2 – 0.6 | Fraction of users active simultaneously (20–60% typical). |
| Average Bandwidth per User | Bu | 0.5 – 5 Mbps (general office); 5–25 Mbps (multimedia, education) | Throughput needed per active client. |
| Total Required Bandwidth | BT | Depends on U × Cf × Bu | Aggregate throughput demand. |
| AP Capacity (per radio) | CapAP | 50–80 Mbps usable per 2.4 GHz; 200–400 Mbps per 5 GHz | Effective throughput considering overhead. |
| Clients per AP (practical) | CuAP | 20–40 (2.4 GHz), 40–60 (5 GHz) | To prevent congestion, far below protocol maximum. |
| Cell Radius (indoor) | R | 10–30 m (5 GHz), 20–50 m (2.4 GHz) | Maximum coverage radius for acceptable RSSI. |
| Area per AP | Aap | πR² (coverage cell area) | Estimated area covered by a single AP cell. |
| Coverage Area | Acov | Varies by project (500 m² – 50,000 m²) | Total site/floor coverage requirement. |
| Safety Factor | Sf | 1.1 – 1.3 | Oversizing to account for interference, walls, and growth. |
Note: These values depend on building type, client mix (smartphones vs. laptops), application usage, and environmental conditions.
Core Formulas for Wi-Fi Access Point Sizing
Several formulas are essential when performing Wi-Fi network sizing. Each accounts for different aspects: user density, throughput, and coverage.
1. Total Concurrent Users
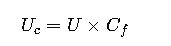
- Uc = Concurrent users
- U = Total expected users
- Cf = Concurrency factor
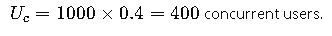
Example: For 1,000 users with 0.4 concurrency:
2. Total Required Bandwidth
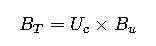
- BT = Total bandwidth required
- Uc = Concurrent users
- Bu = Average bandwidth per user
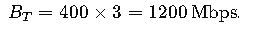
Example: If 400 users each need 3 Mbps:
3. Number of Access Points Based on Capacity
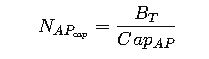
- NAPcap = Number of APs (capacity requirement)
- BT = Total bandwidth required
- CapAP = Capacity per AP (usable throughput)
Example: With BT = 1200 Mbps and CapAP = 300 Mbps (5 GHz):

4. Number of Access Points Based on Client Count

- NAPclients = Number of APs (user density requirement)
- Uc = Concurrent users
- CuAP = Clients supported per AP
Example: 400 users, with CuAP = 50:

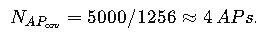
5. Number of Access Points Based on Coverage
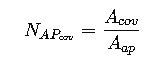
- NAPcov = Number of APs required for coverage
- Acov = Total coverage area
- Aap = Area per AP cell
Example: Office of 5,000 m², with R = 20 m (Aap ≈ 1256 m²):
6. Final AP Count

- NAP = Final AP count (rounded up)
- Sf = Safety factor (1.1 – 1.3 typical)
Example: From above: max(4, 8, 4) = 8. With Sf = 1.2 →

Extended Reference Table: Bandwidth per Application
Different applications place very different demands on Wi-Fi networks. Proper sizing requires knowing these per-user bandwidth expectations.
Table 2. Typical Bandwidth Requirements per Application
| Application Type | Average Bandwidth per User (Mbps) | Notes |
|---|---|---|
| Web browsing / email | 0.5 – 1.5 | Light office usage |
| VoIP call (per stream) | 0.1 – 0.2 | Codec dependent |
| Video conferencing (HD) | 1.5 – 3 | Zoom, Teams, Meet typical |
| 4K video streaming | 15 – 25 | Netflix, YouTube HDR |
| Online education platforms | 3 – 5 | Mix of video and content |
| AR/VR applications | 30 – 50+ | Very high bandwidth and low latency |
| IoT devices (sensors) | 0.01 – 0.1 | Negligible bandwidth but high device counts |
As Wi-Fi 6 (802.11ax) and Wi-Fi 7 (802.11be) adoption increases, capacity per AP grows significantly, but device density remains a critical bottleneck.
Real-World Example 1: University Lecture Hall
Let’s apply the formulas to a lecture hall with 1,200 students.
- Total users (U): 1,200
- Concurrency factor (Cf): 0.5 (50% active simultaneously)
- Average bandwidth per user (Bu): 2 Mbps
- AP capacity (CapAP): 300 Mbps (5 GHz Wi-Fi 6 AP)
- Clients per AP (CuAP): 50
- Coverage area (Acov): 2,400 m²
- Cell radius (R): 15 m → Aap ≈ 707 m²
- Safety factor (Sf): 1.2
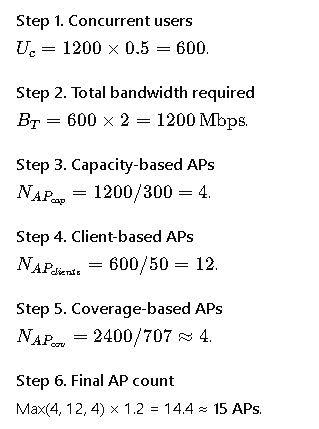
Result: For reliable performance, the lecture hall requires 15 Wi-Fi 6 access points, distributed to ensure proper channel separation and load balancing.
Real-World Example 2: Hospital Wi-Fi Deployment
Healthcare environments are among the most challenging for Wi-Fi design. Unlike a lecture hall or office, a hospital requires reliable, low-latency, and interference-resilient coverage for diverse applications ranging from patient monitoring to mobile clinical workstations.
Scenario description:
- Total expected users: 2,500 devices, including staff laptops, tablets, VoIP phones, and IoT sensors.
- Active concurrency: Approximately 30%, due to a mix of staff working shifts and constant background device traffic.
- Bandwidth demand per device: Ranges from less than 0.1 Mbps for IoT sensors to more than 10 Mbps for medical imaging and telehealth video calls.
- Building structure: Multi-story concrete facility with lead-lined walls in radiology areas, significantly affecting signal propagation.
- Reliability requirements: Near-zero downtime for clinical applications, with redundancy and seamless roaming for critical mobility.
Challenges faced in sizing:
- Client diversity – from low-bandwidth IoT sensors to high-bandwidth imaging systems.
- Coverage reliability – medical devices cannot tolerate dead zones or intermittent roaming failures.
- Environmental interference – equipment rooms, shielding materials, and elevators create unpredictable RF conditions.
- Regulatory compliance – Wi-Fi networks must adhere to HIPAA and healthcare IT standards in many regions.
Design outcome:
- The hospital deployment required significantly more access points than a typical office of the same size.
- Instead of focusing only on user counts, the design prioritized coverage and redundancy, ensuring that no clinical area relied on a single AP.
- In practice, the hospital ended up deploying nearly double the number of APs predicted by simple user-density calculations because of attenuation factors and redundancy needs.
This case demonstrates that environmental and operational requirements often outweigh theoretical calculations. In high-stakes industries like healthcare, network sizing must account for more than just capacity: redundancy, interference mitigation, and failover support are mission critical.
Channel Planning and Interference Considerations
Accurate Wi-Fi sizing is not only about user counts and bandwidth — channel planning is equally important. Even if enough APs are deployed, poor channel allocation can cripple performance due to co-channel interference (CCI) and adjacent channel interference (ACI).
Table 3. Channel Availability in Common Wi-Fi Bands
| Frequency Band | Standard | Non-Overlapping Channels | Typical Use Cases |
|---|---|---|---|
| 2.4 GHz | 802.11n / 802.11ax | 3 (Channels 1, 6, 11) | Legacy devices, low-bandwidth IoT |
| 5 GHz | 802.11ac / 802.11ax | 24 (depending on region) | Modern enterprise networks |
| 6 GHz | 802.11ax / 802.11be | 59+ (region dependent) | Wi-Fi 6E / Wi-Fi 7 deployments |
Key best practices include:
- Limiting reliance on 2.4 GHz, since only three channels are truly usable.
- Prioritizing 5 GHz for capacity, as it supports far more non-overlapping channels.
- Preparing for 6 GHz adoption, which unlocks extensive spectrum availability for high-density environments.
- Enabling Dynamic Frequency Selection (DFS) channels carefully, as they can be disrupted by radar signals.
Proper channel planning must also consider AP placement height, transmit power adjustments, and antenna type to ensure even distribution without excessive overlap.
Attenuation Factors in Wi-Fi Network Design
Wi-Fi signal propagation is heavily affected by obstacles. Understanding common attenuation values is critical when estimating coverage requirements and sizing the AP count.
Table 4. Typical Attenuation Values
| Obstacle Type | Signal Loss (dB) | Notes |
|---|---|---|
| Drywall partition | 3 – 4 dB | Common in office cubicles |
| Brick wall | 6 – 8 dB | Moderate loss, depends on thickness |
| Concrete wall | 10 – 15 dB | Major obstacle in industrial or hospital settings |
| Metal door | 20 – 25 dB | Causes near-complete blockage |
| Elevator shaft | 30+ dB | Creates significant dead zones |
| Glass wall (tinted) | 6 – 8 dB | More loss if reflective or laminated |
These values highlight why theoretical coverage areas are rarely achieved in practice. A 20-meter radius AP cell in open air may shrink to less than 10 meters in reinforced hospital corridors or data centers.
Wi-Fi 6 and Wi-Fi 7 Impacts on Sizing
With the adoption of Wi-Fi 6 (802.11ax) and the upcoming Wi-Fi 7 (802.11be), network sizing strategies are evolving. These standards introduce features that change capacity calculations:
- OFDMA (Orthogonal Frequency Division Multiple Access): Splits channels into smaller subcarriers, allowing simultaneous transmissions for multiple users, improving efficiency.
- MU-MIMO (Multi-User Multiple Input, Multiple Output): Supports multiple concurrent spatial streams, enabling better scaling with user density.
- Target Wake Time (TWT): Reduces contention and improves battery life for IoT devices.
- 4096-QAM (Wi-Fi 7): Increases spectral efficiency, boosting throughput.
- Multi-Link Operation (Wi-Fi 7): Allows devices to transmit across multiple frequency bands simultaneously.
While these improvements increase per-AP capacity, the fundamental design challenge remains: client devices are often the limiting factor, not the AP. For example, most smartphones still have only two spatial streams, meaning they cannot fully utilize an AP’s maximum theoretical throughput.
Therefore, even with Wi-Fi 6 and Wi-Fi 7, access point counts must still be based on concurrency, client density, and coverage, not on theoretical maximum throughput.
Best Practices for Reliable Wi-Fi Sizing
To ensure long-term network performance, engineers should follow these guidelines:
- Always design for worst-case concurrency. User behavior spikes during breaks, meetings, or live events.
- Prioritize 5 GHz and 6 GHz coverage. Keep 2.4 GHz available for legacy and IoT only.
- Perform a physical site survey. Predictive models often miss localized interference and attenuation effects.
- Account for growth and redundancy. Networks should handle at least 20–30% more devices than initial sizing predicts.
- Leverage vendor tools. Cisco Wireless Control System, Aruba AirWave, and Ekahau provide professional-grade predictive and validation tools.
- Design for application type. A hospital streaming telemetry is not the same as a stadium streaming video.
- Ensure proper channel reuse. Overlapping APs on the same channel reduce capacity far more than undersizing AP counts.
- Monitor and adjust post-deployment. Wi-Fi is dynamic; periodic audits are essential to maintain performance.